Canvas analytics and assessment data week eighteen fall 2021

Finals wrapped up in week seventeen bringing the final page view tally to 48,787 for the last full week of the term on the Instructure Canvas platform systemwide. Week eighteen included only a single day of final examinations. Activity clearly peaked with the advent of final examinations. Page views are a metric that functions a proxy for engagement on the platform. The "slump" in engagement seen in weeks twelve and thirteen reflect, in part, the November holiday series. This term the holidays started in the eleventh week and continued into week fifteen. The recover in engagement seen in week sixteen is perhaps no coincidence: holidays negatively impact student engagement during the term.


Assessment
Dashboards
Course learning outcomes fall 2021
General education outcomes 2021.3
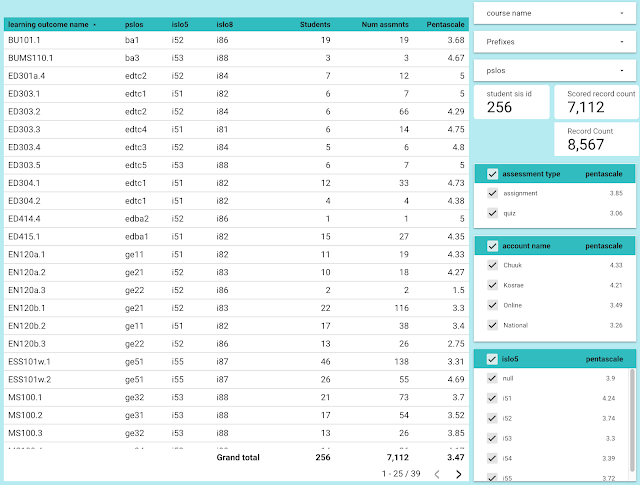
Course learning outcomes assessment fall 2021 dll sis
Pentascale average time series fall 2021
Learning outcome ratings on assignments only 2021.3
Spectacular dashboards: a cautionary tale
Reports
Week one: Assessment available at sunrise on a new term
Week two: SIS disaggregation and a deep dive into mapping decisions
Week three: SIS disaggregation and another dive into mapping complexities
Technologies available to students
Week four: A focus on subaccounts and campuses
Week five: Pivot of state of origin versus gender
Week six: Dashboards can be focused
Attendance versus performance in statistics
Week seven: Outcome performance at the course level and other dashboards
Week eight: Update at midterm
Week nine: A look at score and grade distributions
Week ten: Grey goo revisited
Week eleven: Update on the numbers
Week twelve: Page views collapse
Week thirteen: Holiday impact or disengagement?
Week fourteen: Some indications of reengagement
Week fifteen: A look at courses ranked by learning
Week sixteen: Engagement surge
Week seventeen: Numbers in the week in which classes ended


Comments
Post a Comment