Setting up a boxplot chart in Google Sheets with multiple boxplots on a single chart
The Google Statistics add-on for Google Sheets can display multiple boxplots in a single chart. The key is the layout of the data. One column should be the variable by which the data is to be grouped, the other column should be the data to be box plotted.

Set up the Statistics add-on with the data to be plotted as the variable, and the grouping column as the "by" variable. In this image I had deselected all but the boxplot option, the result was the appearance of the Moment, Standard errors, and Confidence intervals options. The default is apparently a 95% confidence interval for the mean.

The result is multiple boxplots on a single chart with a common scale. The new tab that is created also quotes 95% confidence intervals for the mean. Note that as of 2018 the Google Statistics add-on cannot be found by search in the add-ons. In addition, as of May 2018 the add-on no longer verifies, possibly due to the add-on not having been updated since August 2017. One may have to essentially force verification of the add-on using the advanced link in the verification dialog box and then re-authorizing the add-on. I continue to hope that Google will eventually integrate the functionality of this add-on into Google Sheets.
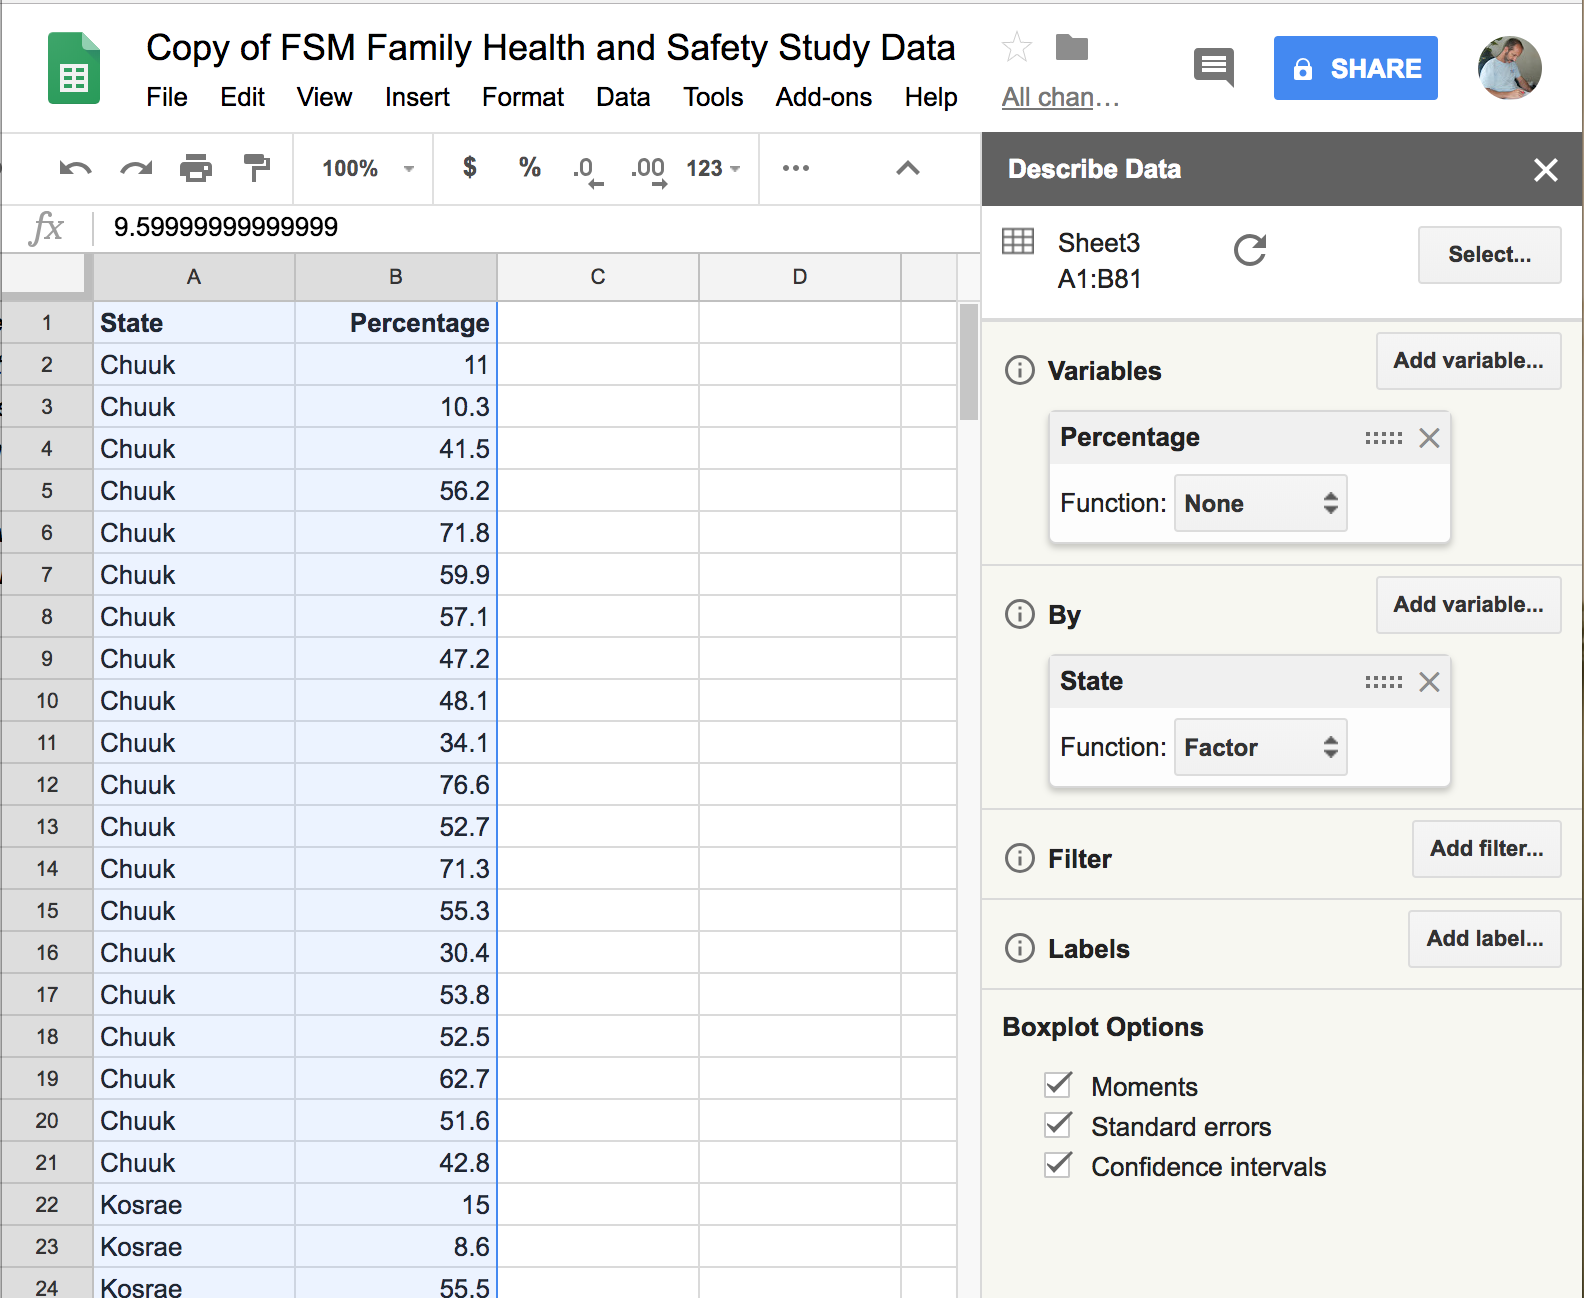


Comments
Post a Comment