Posts

Showing posts from May, 2022

Powering the assessment dashboards from Canvas to Data Studio

Image
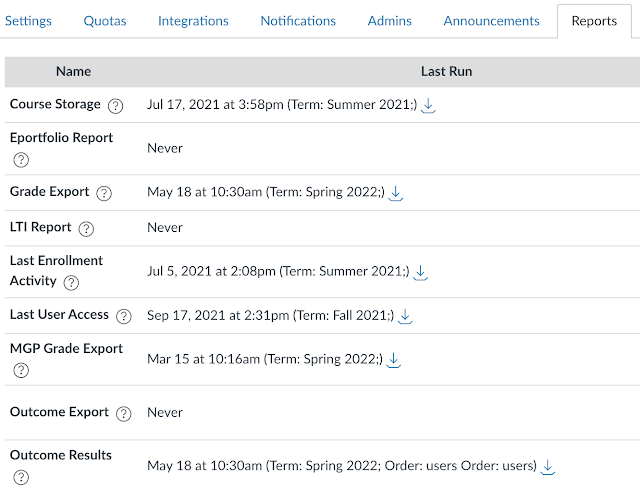
A series of dashboards have been designed to meet the insight and assessment needs of instructional coordinators,  program coordinators, and counselors. Demonstration dashboards have also been built for instructors and academic advisors. All of these many dashboards are powered by data from just two comma separated value tables exported from Instructure Canvas. Canvas refers to these as reports, they are both accessed from the admin reports.  Up front I want to thank Kansas State University's office of assessment whose assessment workshop videos from 2020 started me on this journey in March 2021. At first I thought I needed Canvas Data and either PowerBI or Tableau. Then I watched the Kansas State videos more carefully and realized that the data was available as a report . I could also see that these reports were being used to drive dashboards. Although I lacked PowerBI and Tableau, I stumbled into Data Studio in the newly acquired Google Workspace for Education. By late March I

Cohesion, consensus, culture, and community

Image
Culture eats strategy for breakfast and transformation for lunch. Strategic plans that are not built on a foundation comprised of the corporate culture will not be achieved by an organization. Transformations that run counter to the corporate culture will fail by lunch time. What are the core values of the college? And not those crafted with an eye towards external appearances - a list perchance borrowed or based on what other some other institution has crafted.  A culturally diverse multilingual student body means one can speak five languages on a walk across the national campus; the four state campuses all have a different L1 language At the recent incentive awards day a question was asked of the gathering along the lines of, "What are the five core value statements for the college?" When no one initially answered, my mind was thrown abruptly and unexpectedly back many years ago to a summit that sought to establish college value statements. In the group I was in, discussion

New management tooling for Instructure Canvas outcomes

Image
The following report includes information on a new feature set for outcomes from a Canvas webinar and current practices on the platform at the college. Three areas will be covered in the webinar. What are outcomes? Account settings and feature options Teacher/student/observer view Outcomes need to have some sort of scale. They must be measurable. Vocational often uses a binary rating scale on outcomes: 0 not yet competent. 1 Competent. Five point scales are also common. The college is presently using a modified five point scale. The logic behind this choice of scale can be read about at: http://danaleeling.blogspot.com/2021/03/learning-outcomes-assessment-ratings.html A poll was run to determine the level at which attendees are currently using outcomes. I answered C: We have provided some outcomes training but teachers are not required to use outcomes in Canvas. Eleven out of 81 courses on Canvas are reporting course learning outcomes (14%) that were pulled from the inst

Student evaluation comments spring 2022

Image
Students have submitted 1072 evaluations of their instructors, courses, and course materials. The responses were primarily from the national and CTEC campuses. There are four open answer questions on the evaluation form. Changes Needed: Please write down specific suggestions you would like to make for this instructor. Changes Needed: Please write down specific suggestions you would like to make for this course. Changes Needed: Please write down specific suggestions you would like to make for the course materials in this course. Other Comments:  If you have any other comments you would like to share about your course, distance learning, your instructors, or your experiences at COM-FSM, please write freely here. Your answers will be read and kept strictly confidential. Many students choose to leave the open answer comments blank, or write in "none", "N/A", or "No comment."  Instructor comments  After removing the blank responses and those who wrote "non

Canvas analytics week 17 spring 2022

Image
Week seventeen marked the end of term with final examinations on Wednesday, Thursday, and Friday of week 17. Engagement as measured by page views on the Instructure Canvas platform showed a third straight week of gains, climbing to a value not seen since the third week of classes and outperforming gains seen term-on-term from fall 2021.  Page views stormed to a fourth highest 89978 views for week seventeen.  Although by week seventeen most faculty might be expected to have already put in place their final assignments including their final examinations on the platform, there were still gains in assignments, discussions, and media recordings. Student numbers continued to slide. Although the college is past the last day to withdraw with a W, the students can still execute an online withdrawal with an F. Average engagement by day of the week across the whole term confirms that Saturday is a day of lowest engagement on average. This speaks to a comment made by a student on a course evaluati

Instructure Canvas and Data Studio dashboard for instructional coordinators

Image
The above is a prototype dashboard designed to provide instructional coordinators with insight in course performance both in terms of scores in a course and outcome performance using Instructure Canvas and Data Studio.  The data driving the dashboard derives from two Canvas administrative reports that are available as CSV files, the Grade Export table and the Outcome Results table. These are then imported each into their own Google Sheet which are then connected to Google Data Studio. The two tables are added to a blend as seen above. The join will be on the common fields of course id and section id.  The section ids appear to be unique and the dashboard was originally built on only a section id join. Without documentation that section ids are unique values the dashboards were updated with a join on the course id as a precaution. This may not be necessary. The dashboards include the ability to drill down to sections, hence the need for a join at the section level.  The college has six

Student evaluation rating scale grid results spring 2022

Image
Students in courses at the college anonymously submitted responses to a student evaluation survey. Students were instructed to fill out the survey once for each course they were in. The data below derives from multiple choice items on 1058 surveys.  Students tend to Agree (4) or Strongly agree (5) across almost all metrics. The overall average for all sections on a five point scale where 1 is strongly disagree and 5 is strongly agree was a 4.32 with a standard deviation of 0.08. The data is distributed remarkably narrowly around the mean. In general, students tend to favor agreeing with statements rather than disagreeing. This makes determining areas of strength and weakness harder to discern.  To better identify differences in the metrics, areas of relative strength and weakness, the horizontal access for the charts below is essentially a form of a t-statistic. The value is the number of standard errors of the mean above or below the overall mean for that particular average. Areas of