Posts

Showing posts from June, 2021

Summer session 2021 week four analytics

Image
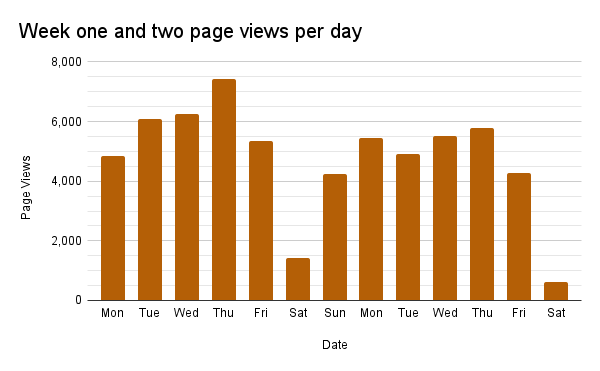
Week four in the summer term ends a day early with the midterm break Friday at the end of the fourth week. While the number of assignments, discussions, files, and media recordings increased, the number of students dropped slightly.  Category Week one Week two Week three Week four Active courses 19 20 21 21 Teachers 10 10 10 10 Students 212 250 277 269 Assignments 477 534 584 654 Discussions 66 78 101 110 Files 800 850 876 900 Media recordings 84 176 263 340 The number of students active in Canvas courses dropped by eight students. Canvas analytics cannot provide a definitive cause for the drop in the number of active students, but the most probable cause is withdrawal of students from courses either by faculty or the students.  Activity on the Canvas platform saw a Monday peak this week, which coincided with the first day of midterm examinations on the schedule. Thursday had not come to a close at the time this report was written, but activity appears to be tapering one day earlier th

RipStik sine wave regression mathematical model laboratory

Image
Summer term with online lectures and residential labs meant that the introduction to waves using a RipStik could only be presented via a video.  The evening prior to laboratory nine I found that Desmos  could regress to a sine function if given the five points seen in the image above: three centerline points and the peak of a crest and the bottom of a trough. The regression remains fairly stable for small perturbations of the data points. Prior experiments had yielded unstable results often with extremely high frequencies. This would form the gist of laboratory nine. I started the build of the poster paper inside and then moved outside. Wind, even the slightest of breezes, is problematic.  Scotch tape was used to assemble an eight sheet run. Each sheet is 83 cm long, thus the whole run was 664 cm. The wind held off long enough to make the run. The run was made barefoot as notes from prior terms on runs made during a Monday lecture-demonstration suggested a larger amplitude and more con

Summer session 2021 week three analytics

Image
Week three system wide analytics show twenty-one active courses led by ten instructors with 277 students engaging in those courses.  Category Week one Week two Week three Active courses 19 20 21 Teachers 10 10 10 Students 212 250 277 Assignments 477 534 584 Discussions 66 78 101 Files 800 850 876 Media recordings 84 176 263 Page views provide a rough measure of engagement levels.  Thursdays appear to be the day of peak page views each week, with Thursday of the third week showing the highest number of page views per date. Page views refers to both faculty and students viewing pages in Canvas. These could be assignment pages, module pages, quiz pages, anything that constitutes a page in Canvas. Page views are a proxy for engagement with the web site.    The remainder of this report looks only at MS 150 Statistics and SC 130 Physical Science, the two courses taught by the author summer 2021.  Submissions in MS 150 Statistics continue to remain on par with residential rates of assignment

Summer session 2021 week two analytics

Image
Week two system wide analytics show twenty active courses led by ten instructors with 250 students engaging in those courses.  Category Week one Week two Active courses 19 20 Teachers 10 10 Students 212 250 Assignments 477 534 Discussions 66 78 Files 800 850 Media recordings 84 176 Page views provide a rough measure of engagement levels. There is not enough history in the college data to be certain, but some drop in page views per day from week one to week two might simply be the result of faculty having pushed up page view counts during course set up activities.  Saturday remains the day of lowest engagement with the Canvas platform, with peak engagement again occurring on a Thursday. In my own courses logins and submissions have shown slight gains. All students have logged in at least once, and almost all of the students have submitted at least one assignment.  Submissions in MS 150 Statistics remain on par with residential rates of assignment submission. The drop in the number of su

Acceleration Energy Friction

Image
Week two began with measuring the acceleration of gravity. This laboratory is no longer led off by two days of acceleration, thus the front end of the laboratory was spent introducing the concept of acceleration. This has lengthened the duration of the laboratories, with some laboratories extending out beyond three hours. Blossom and Allison measuring from two meters Nicole and Angelica entering data Joyleen working at two meters Shrue Blossom preparing  Angelica and Joyleen working at two meters Four and five meters can be done safely from the porch.  Data came in low for all the groups this term, no particular reason could be identified. The board reflects the path from laboratory two linear motion to accelerated motion - a hand waving argument built off of the three slopes.  Laboratory four followed the same setup as spring 2021 with the double chairs being used to secure the leaves.  The laboratory was preceded by the demonstration of the conservation of momentum for marbles on a r