Posts

Showing posts from September, 2019

Graphical confidence intervals for a linear regression in Google Sheets

Image
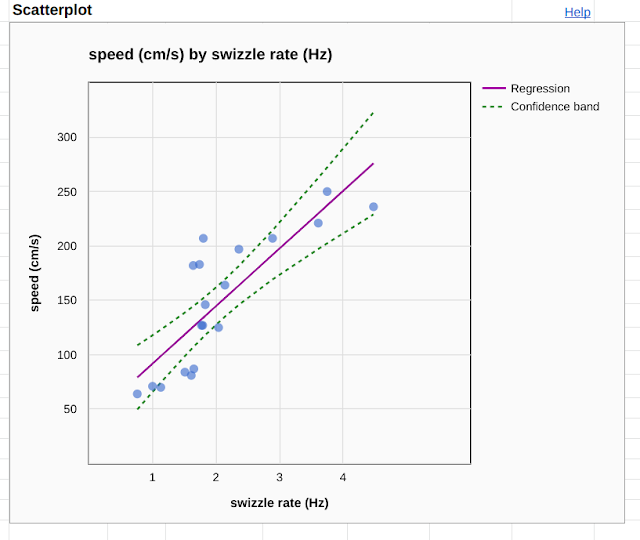
For a brief period of time Google Sheets had a Statistics add-in which generated graphs of regressions lines and 95% confidence intervals for the regression line graphically. The graph above provided a visual approach to whether a slope could possibly be zero. A possible slope of zero would leave open the possibility of no relationship between the variables. The Statistics add-on was credited to "Google Developers" and was eventually removed as an add-in. Google lost a number of capabilities with this deletion, including boxplots. The LINEST array function   available in Google Sheets since 2016 , when configured to do so, will provide the information necessary to calculate the 95% confidence interval for the slope and the intercept. This provides a numeric answer to whether a slope could be zero, is more precise than a chart, and yet is less visually satisfying. The above analysis show that a slope of zero is possible and that the negative slope is not necessaril

Heat and temperature

Image
Monday I showed a 1980 set of videos on heat and temperature by the Ontario Educational  Communication Authority that was acquired by the MITC in VCR format circa 1993 . Those videos remain one of the best introductions to temperature and heat which is comprehensive and fits into a 50 minute period comfortably. Wednesday I ran a series of temperature demonstrations. This term the coconut oil was held in the refrigerator from the night before, and melted more decisively at 20°C. I also briefly mentioned three of the ways heat moves. Joyann with Dickenson, Mauriney and Rodman Thursday I was looking at the metal cups and realized that the students could use three different materials. Joyceleen and Darall Mauriney and Rodman  The board layout this term did not focus on confirming Newton's law of cooling, this was not mentioned until the end of the lab. I also opted not to use a variable Tmax and Tmin but rather to use 100°C and the measured room temperature

Ohigan in photos

Image
Ohigan this term was the last scheduled class session for this term with the students cleaning up an ethnobotanical area. The last two clean-ups, of the banana patch and the ethnogarden behind the gym were dropped from the calendar to permit inclusion of iNaturalist in the curriculum. Given the increasing lack of skill with machetes, I am inclined to think this might be the last session with machetes. Perhaps time for the class to move on. A Cyathea nigricans has sprouted through the middle of the rock pile.   The presence of Cyathea in the ethnogarden is a real plus for the class. The Coffea behind me remains toppled over since last spring. Toppled but still alive. Unknown whether this is Coffea robusta or Coffea arabica, but I have long suspected this is more likely to be C. robusta.  The mix of plants is increasingly complex and still mostly invasives. Clidemia hirta  A lot of Allamanda   Paltiela on the right cleaning up with a machete Spat

Friction

Image
The absence of the banana leaf marble ramp and the associated RipStik velocity versus height exercise has diminished the demonstrations impacted by friction. Friction does not really arise as complicating the data gathered. Friction makes a first appearance during Newton's first law - an object in motion tend to remain in motion unless acted upon by an external force. And friction is an example of an external force that tends to work against perpetual motion. Rodman and Eric work on the role of weight in the force of friction Joyann pulls a constant weight sled while Ellena records data. This term I realized that the grit measurements are made easier by weighting the sled. The empty sled as a very low pulling force, the weight brings the pulling force up and permits the use of a midrange scale. This is useful as the low end scales are usually in use by the groups measuring weight versus frictive force. Joyceleen and Dickenson will be working on weight versus for

First light for Dropout Detective

Image
Today was first light, to borrow an astronomical term, for Dropout Detective. Immediately upon opening the app I was made aware of three students in my course who were identified as being at risk of dropping out of my course. Two of the students were students for whom I was aware that they were struggling, but the third was one I had missed. Within an hour I was able to meet with two of the three students and follow-up on the missing work that underlay the high risk index position. I am still looking to follow-up with the third student. That the system surfaced students I expected to see surfaced was reassuring, that the system was able to surface students I had not realized were in difficulty in the course, that was real value to me as an instructor. This is the real time dashboard that I need to see students in difficulty at a glance.

Swizzle rate versus speed for RipStik

Image
Correlation is introduced in MS 150 Statistics using data from swizzle rates versus speed gathered in class. While the example is somewhat silly, generating the data is fun and perhaps memorable for the students. More memorable than fifty solid minutes of lecture. I used an 800 centimeter run as I have done for the past couple of terms. 800 provides enough distance for the swizzle count to be reasonable - shorter distances would reduce the swizzle count which would inevitably increase the error in the count. A difference between two and three is a 50% difference, out at 11 and 12 the difference is under 10%. The ground is fairly level, but there is a hint of a slope and I ride up against that small slope to avoid the acceleration of gravity. Data, which varies term to term,  is available in a spreadsheet . The data has a positive relationship. In this course the focus remains on grasping the basic concepts around a linear regression. Even in this small data set, however

Healing plants walk into Paies

Image
A steady rain prevented photographic images from being captured on this wet walk. Twenty-one students of twenty-four reported for class. By the end of the walk up in Paies, Kitti, seventeen students would still be present. All were as rain ready as possible, and the walk went reasonably well under continuous rain. A handout cross-referenced the Latin name to local name, although the rain prevented the handout from being useful during the hike. The hike included Premna serratifolia, Morinda citrifolia, Terminalia catappa, Volkameria inermis, Ocimum tenuiflorum, Scaevola taccada, Premna obtusifolia, Glochidion ramiflorum, Cordyline fruticosa, Melastoma malabathricum, Macrothelypteris torresiana, Piper methysticum, Piper ponapense, Phymatosorus scolopendria, Hedychium coronarium, Crinum asiaticum, Ixora casei. I did not locate Plectranthus scutellarioides on this walk, I am unsure what happened to the large plant near the corner, but then coleus does seem to die back mysteriously out

Change in momentum is force on a good day

Image
The day dawned clear, promising to be hot, and the sun delivered the heat. I was well prepared to attempt to duplicate the one off success of spring 2019 . The demonstration that the force applied to a moving system is equivalent to the change in momentum is a demonstration that has a long history of failure. My earliest attempts entangled energy considerations  which obscured the role of momentum. Other very early attempts tried weights dropping from cross-members of the covered walkway - friction meant the weights did not fall back down and the result was hazardous. I also tried variations on pulling from early on , but often met with failure. A failure fall 2018 was due to a student holding the piston of the spring scale, this actually occurred again this term. When told the spring scale should read 20 Newtons, the students oblige by setting the scale to 20 Newtons and then holding both ends of the scale. I also failed to make clear that the student had to run backwards at an