Posts

Showing posts from October, 2019

Halloween statistics 2019

Image
Halloween 2019 saw a distinct drop in the number of groups and children seeking sweet treats. The low tally is certainly partially attributable to an increased security presence in the area, yet that alone would not account for the lower turnout. Children appeared to be able to freely move through the security point, some perhaps chose not to do so. A Thursday school night may have had some impact, there are surely other factors that impinged on the candy count this year. Total candy distributed fell from the running average of 473 down to 128 this year. Note that in 2017 and 2018 numbers were limited by candy exhausting prior to eight in the evening, with 2018 running out of candy by 7:49 PM. No "mega-groups" of youth were seen this year, groups of over thirty. The largest group came in at 24, and that was the sole outlier in the data for this year.
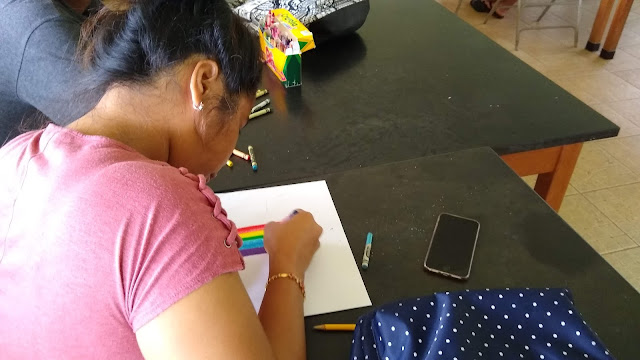
Spectrum of visible light revisited and redesigned

Image
Each term I have the students in SC 130 Physical Science view the visible spectrum using a CD spectroscope . This follows the viewing the Limits of Light . I have used the CD spectroscope exercise both to frame the visible light spectrum lecture and to tackle the "issue" of indigo . This term I added a slight twist to the lecture demonstration session. Staisy I brought crayons and drawing paper and asked the students to draw the spectrum. This had an unexpected consequence: for the first time students were going back and looking at the spectrum again. As this happened I suddenly realized that the students had been only glancing at the rainbow without really analyzing what colors they were seeing and in what order. The introduction of sketching the spectrum shifted this up to the thinking taxonomy to analysis.  Mauriney, Ellena, Joyann This also led directly to the issue of indigo, with some students working to ensure that they had seven colors including indigo.

Paper aircraft flight distances run as a two independent samples t-test for a difference of means

Image
Usually the " paper aircraft exercise " is done as an example designed to capture a known, pre-existing population mean. This term a string of rainy mornings prevented this exercise from occurring in chapter ten . Good weather landed on the morning of 11.2 , so I opted to divide the class into a group one and a group two and then testing to see which group, if either, could achieve a greater average flight distance. Given that there were no criterion for being in one or the other group (the students were split by the side of the room in which they choose to sit), the expectation would be no difference in the means. Folding Flying Distribution on the ground Distances were measured perpendicular to the building. Aircraft that landed on the first floor porch were negative distances. Once the data was entered and the means were calculated I asked the class, "If we threw the planes again, would we get the same average distance? Could the averages reverse th

Thatching

Image
This term the thatching activity was the first session for material culture in the SC/SS 115 Ethnobotany course . As a result, I opened the class with an introduction to material culture and the loss of material culture. As usual I digressed, too many ideas tumbling around in my head when I try to tackle material culture. Then I introduced thatching and invited the students to try their own hand at thatching. Some had done this before, but as in terms past, a few noted that this was their first time to try making thatch. The Chuukese students noted that they use a braided thatch done using coconut leaves that involves no sewing. I have seen such thatch, islands where coconut is used as thatch often appear to use the woven/braided thatching approach. Sheeron starts doakoahs en ruhk MJ works on separating the nohk with the intention of making a broom Berg begins doakoahs en ruhk Flores starts his thatch Don, Luckyleen, Jaylino, Flores, MJ, Myrantha, Gavrin, Hart,

Vegetative morphology: a few leaf shapes

Image
Obovate with pinnate venation: Terminalia catappa Eve Sophie and Gary study the handout Terminalia catappa leaf arrangement: whorled Terminalia catappa cotyledons: two, dicot! Ischaemum polystachyum: parallel venation, linear morphology  Ipomoea carnea: roughly cordate Macaranga carolinensis: roughly orbicular with a peltate petiole Sheeron and Jossel in the foreground, Adore in the back. Paltiela "Pala" used Senna alata alternately as a fan and a sun shield Senna alata: compound leaf with oblong leaflets Leaflets on Senna alata Gary, Don, Jossel, and MJ study their guide sheets Xanthosoma sagittifolium: sagittate Marissa, Myrantha, Sheeron, Don, Jaylino, Berg, Jossel, Gavrin, Luckyleen, Eve Sophie, and Gary Centella asiatica: reniform Gavrin and Marissa

Observations with iNaturalist in ethnobotany

Image
In an earlier class I had attempted to introduce iNaturalist via having the students make identifications of common and easily identified plants (think coconut palm, the only species in Cocos). As not all of my students have smartphones (nor digital cameras for that matter), I felt that starting in a computer laboratory doing identifications would let all of the students participate. As I set up the class I learned that accounts with zero observations were more likely to be flagged as spam accounts by the anti-spam system in use. I now consider that the students have to start with observations and hope to rearrange for that in the spring term. The goal for today was to have those students who had smartphones go out and make an observation or two and then return to the laboratory to annotate the observation and add observation fields. This agenda would prove overly ambitious. As some students did not have smartphones, they were instructed to simply tag along with students who have sm

Waves

Image
Waves opened with a four sheet RipStik wave on the sidewalk. The speed was reduced to push the amplitude. The run requires a stopwatch and a tape measure for use post-run. Reducing the forward speed and focusing on deep cycling of the RipStik enhanced the wave form. Wavelength was covered first and then the amplitude. The average wavelength was computed from 3.35 meters divided by 2.5 waves. The students decided that 2.5 waves were present. Then the period and frequency. Wrap included the sine function and the wave speed (seen on the leftmost sheet above). Equipment for Wednesday. Wednesday wrapped up with an oscilloscope app to show that sound waves are sine waves two. A function generator app was also used. Thursday's measurement of the speed of sound requires a fair amount of equipment and I still forgot to bring a pen. Not shown: a pocket knife to cut the tape in the event field repairs to the clappers might have been needed. Zero