Posts

Showing posts from November, 2016

Google Sheets xy scatter graph charts gains ability to display linear regression equation on chart

Image
At some point Google Sheets gained the ability to display the equation of the linear regression trend line on the xy scatter graph. With a trend line added to the data and the legend set to display, there are additional customization options in the advanced edit dialog box: The location of the legend currently affects whether R-squared, the coefficient of determination, is visible in the legend. These features are "early days" and there appear to be some kinks to work out. Beyond being on the right or below, the legend can also be displayed inside the chart area. While R-squared disappears, the linear regression equation displays in a layout that will be less confusing to a student. This capability furthers the capacity of Google Sheets and Google Docs to produce laboratory reports for courses such as physical science.

Ethnogardening and a visit to a trench

Image
As the ethnobotany class prepares for the final examination walk and ethnobotanically identify plants, the class cleaned up one of the ethnogardens on campus and then visited a trench. LynnJella cleans around the Senna alata, arakak in Chuukese. The plants are an integral part of the course. The plants are in some sense the living text book.  Siorine also working around the Senna alata, tuhke en kilin wai in Pohnpeian. Yostrick Tom All photographs were by Lienna, Mary-Ann is artistically eclipsed by a Senna alata branch LynnJella Dannia and April make notes That would be the instructor cleaning up around a Myristica fragrans seedling (unseen in image). April strikes a pose behind the Cymbopogon citratus (reh pwo mwahu). Genrisa Joyleen David next to the Gardenia jasminoides (iosep). Genrisa next to the Saccharum spontaneum, wild sugar cane. By four the garden was clean and given that Naoya is Japanese and that Sasha,

Mathematical models and flying saucers

Image
Laboratory fourteen is the penultimate laboratory in physical science and the last laboratory with a written report submission. This term I opted to de-emphasize the exploratory nature of the laboratory. Last summer the laboratory explored the relative flying characteristics of four different classes of airborne objects: ball, disks, rings, and an Aerobie . Data was shared to the board and the students were instructed to make four graphs. This term the class began with four objects, although the Aerobie would eventually be set aside by the group using the Aerobie due to difficulty picking up the disk on the radar gun and due to the extreme flight distances generated by the disk. Rayleen and Ashly The class formed a line and I measured the speed of the objects as they threw the objects at me. Gayshalane readies to throw at Kenoma Tricia shows off her throwing form - there is room for fun in physical science The data can be quite scattered. This term I focused on

Authentic assessment in statistics

Image
The shift in statistics education to an emphasis on data exploration and analysis coupled with a drive in collegiate education for authentic assessment of skills has led to my trimming statistics content to provide space for students to engage in open data exploration and then presentation of their analysis to the class. Patricia Paul In February 2016 a draft document of the American Statistical Association  (ASA) updated the Guidelines for Assessment and Instruction in Statistics  Education (GAISE) at the college level. The original GAISE document has guided the slow evolution of MS 150 Statistics at the college. Sarah Elma Rieuo The draft has slightly modified the original recommendations: Teach statistical thinking. Teach statistics as an investigative process of problem-solving and decision-making. Give students experience with multivariable thinking. Focus on conceptual understanding. Integrate real data with a context and purpose. Foster active learning.

Banana patch ethnogarden clean-up

Image
An active, living ethnogarden seems to me to be an essential component of any ethnobotanical course. The banana patch is part of the ethnobotanical collection at the college. The following is a photo-essay on the session. The banana patch was a sea of Clidemia hirta Siorine hand pulls Clidemia hirta Yostrick works at the base of a hybrid Mitch pulling Clidemia hirta LynnJella  Joyleen Mary-Ann cleans the dead leaves off of a banana Joyleen cuts a dead banana Mitch at work Dana Joyleen Dana, LynnJella Ann-Julie wants nothing of the photo documentation Jon Jovi

Real fruit group poster presentation

Image
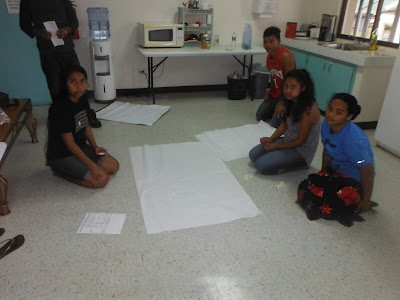
In ethnobotany class angiosperm diversity is covered in a set of three classes: vegetative morphology , floral morphology, and fruit types. This term the invasive species walk was moved ahead of this set of three classes. In past terms invasive plants has been behind the three. This structure worked well, shifting the invasive walk focus onto finding and identifying invasive species and away from a rehash of forgotten vegetative and floral morphology. Ann-Julie, Mitch, Tremay, and Dannia "Bring an edible fruit to classify and share" had been done as "this is my fruit and it is a..." presentation in A101. Last term that session went somewhat awry as some students ate their presentation before presenting. I wanted something different, something that might generate more discussion and appreciation of the potential gray areas. A gray area: cacao I decided to attempt to have the class build a single fruit classification diagram including the fruit that th