Posts

Showing posts from July, 2015

Technology as educational motivator, formative assessment tool, and documentation of both

Image
The voice on my arm chirped "Four kilometers. Twenty-four minutes and ten seconds. Five minutes and fifty-three seconds per kilometer." With that data I knew I could run a sub-30 minute five kilometer time, but I would have to push harder. That is formative assessment at its absolute best: exactly the data the student needs at the exact moment the student needs that data and delivered in a way that was completely accessible to a student with his hands full. When I run, I juggle, a sport called "joggling." Joggling means my hands are literally full and constantly in motion, I have no ability to check a wrist mounted pace monitor ~ ~ ~ "How are you doing in that class?" I asked Bill as part of a advisor-advisee conversation just after early warning. "I don't know," he responded. "Why not?" I asked. "The teacher has not marked any of our papers, we don't have a grade yet," he replied. At midterm I asked B

Cubic bezier sine wave in SVG

Image
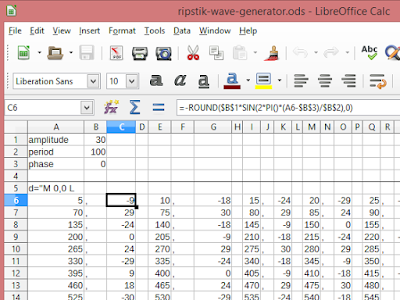
In the past I generated the Scalable Vector Graphics path for a sine wave by using a sine function and inputting x values. The difficulty with this approach is that the crests and troughs become unsmooth at combinations of high frequencies and high amplitudes. I had to increase the sampling density along the x-axis to smooth out the crests and troughs, which led to very large blocks of coordinates in the path command.  This summer I found that a cubic bezier could generate a cosine curve using just the points at the crest and trough, with control points at 0.1875*wavelength and 0.3125*wavelength. Those values were visually determined, not mathematically obtained. The result is a smooth cosine wave of any combination of wavelength, frequency, and amplitude. A transform="translate(kÏ€,0)"can then move the cosine curve horizontally to generate a sine wave. Masks can be used to hide unwanted portions. The cubic bezier routine can be seen in the code undernea

Assessing learning in physical science

Image
SC 130 Physical Science proposes to serve two institutional learning outcomes (ILO) through four general education program learning outcomes (GE PLO) addressed by four course level student learning outcomes (CLO). Not listed are proposed specific student learning outcomes that in turn serve the course level learning outcomes.  This report assesses learning under the proposed course level learning outcomes which in turn supports program and institutional learning outcomes. ILO 8 . Quantitative Reasoning: ability to reason and solve quantitative problems from a wide array of authentic contexts and everyday life situations; comprehends and can create sophisticated arguments supported by quantitative evidence and can clearly communicate those arguments in a variety of formats. GE PLO SC 130 CLO 3.5 Perform experiments that use scientific methods as part of the inquiry process. 1. Explore physical science systems through experimentally based laboratories using scientifi

Assessment in algebra and trigonometry

Image
MS 101 Algebra and Trigonometry now includes a course wide student learning outcome common math assessment (CMA) along with a more traditional final examination (FX). This provides the opportunity to compare performance on the common assessment versus the final examination. Summer 2015 fourteen students enrolled in and completed the course. As with any course, the focus and parameters vary by instructor. My own approach includes an open book evaluation, the elimination of all rote memorization, a de-emphasis on trigonometric manipulations, the inclusion of exponential and logarithmic regressions using spreadsheets, the use of trigonometry in contexts such as scalable vector graphics programming, and the use of technologies such as the WolframAlpha engine to aid in solving problems. Student using WolframAlpha app on Android  The common math assessment is intended to evaluate the following student learning outcomes: 1.1 Solve and evaluate exponential equations and functions.

Mathematics only in a context

Image
I tried a slight twist on the last laboratory of the summer session. I walked into the room empty handed and then began an abstract lecture on site swap mathematics. I deliberately avoided placing the notation into a context, introducing the topic as an abstract system of symbolic notation and manipulation. Note that I labeled the sites as alpha and beta, referring only to objects by color names. "The purple will move three sites down from alpha to beta, then another three sites from beta back to alpha." Perdania I initially put up a 3 and then showed that one could swap two site to yield the 42 seen in the middle of the pattern above. I noted that sums and averages were invariant under a site swap. The students dutifully took notes and worked on drawing the diagram. Jayann With the above on the board, I went around the room to orally check for understanding. Seven of the fourteen students smiled and nodded yes when I asked if they felt they basically under

Story time and predictions with mathematical models

Image
I had the students read from 13 Planets as a follow-on activity to the Journey to the Edge of the Universe video yesterday. Although somewhat unorthodox, I noted that the exercise would clarify some of facts that are so colorfully tossed around in that video. Perdania reads, covering the sun. Joemar practices his reading technique Rofino demonstrates good reading out loud technique. I had noted the importance of reading to children and that this exercise also exemplified that skill. Cherish faces the class, but then the listeners cannot see the picture. Sharon reads. Pendulum data predictions. For the lab, the students measured length versus period for the pendulum in the classroom and then used a linear regression to predict the period to predict periods at longer lengths. In class the students topped out at about 150 centimeters. Predictions were on a linear model. Eddie with the in class rig. Then the class moved to the gym where a 700

RipStik for vector exposition and addition

Image
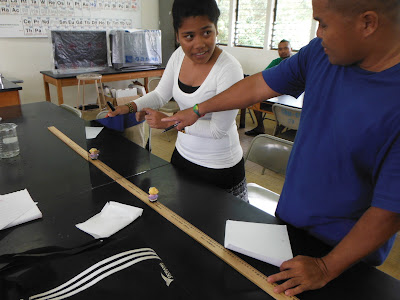
Vectors are fun. I sat in the computer laboratory staring at section 8.3 of Larson's Algebra and Trigonometry text. Nothing I saw on the page looked like fun. My mind wandered to my RipStik. And then in a flash I knew I wanted to fling a ball at a right angle from a moving RipStik and use the radar gun to get the ball launch speed. The RipStik could be timed across a distance with a stopwatch.  Kenneth used the radar gun to obtain the ball launch speed. Marla timed the RipStik over an 800 cm distance. She obtained a time of 3.28 seconds for a RipStik velocity of 243.9 cm/s. Maggie handled the RipStik riding and ball launching, freeing me up to photo-document the experiment. Lecture then proceeded on the sidewalk. Note that the radar gun measured in kilometers per hour. 31 kph was 861 cm/s. The ball was thrown perpendicular to the path of the RipStik directly at the radra gun, but the path over the ground, and the net velocity vector, carried the ball towards th

Marking revised submissions in Schoology

Image
In the middle of working my way through four different laboratory report assignments for my fourteen students each with its own rubric and which included both first submissions and revised submissions, I looked up for a moment and simply gave thanks for Schoology . Summer session is fast and furious, with the course clocking three full laboratories a week each with a report. With resubmissions of prior work and current submissions, both the students and I can become confused in the fog of a busy week. Schoology clears the fog and allows both the students and I to succeed. When marking a revised submission I have my prior comments in full view on the right, the resubmission in the center screen, access to all prior submissions from a drop down menu on the left, and the marked rubric upper center right. No shuffling through papers, no need to require the student to hand in the earlier (and often lost) draft with the new draft - that is so paper based. I am instantly up-to-speed on w

Mirrors and floral litmus solutions

Image
Mirror, mirror, on the table, how deep inside the mirror is that image of the doll? Jayann and Michael work on the Diopulos-Roby theory that the relationship is one-to-one linear with a slope of one. Perdania and Eiko measure a toy pig. Rofino Roby attempts to verify his own theory. Julie-Ann Ardos with her floral litmus solutions, Joemar testing to see if detergent is acidic or basic. Barry Diopulos works with his floral litmus solution. This term the Sphagneticola trilobata did not produce clear indications of acid or base. Barry and Eiko study an unfamiliar substance: cream of tartar. Alwin Alik studies the test tubes.