Posts

Showing posts with the label Datastudio

Powering the assessment dashboards from Canvas to Data Studio
Image
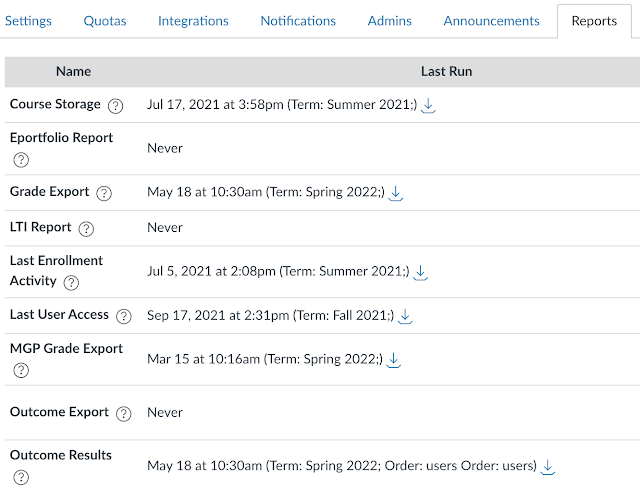
A series of dashboards have been designed to meet the insight and assessment needs of instructional coordinators,  program coordinators, and counselors. Demonstration dashboards have also been built for instructors and academic advisors. All of these many dashboards are powered by data from just two comma separated value tables exported from Instructure Canvas. Canvas refers to these as reports, they are both accessed from the admin reports.  Up front I want to thank Kansas State University's office of assessment whose assessment workshop videos from 2020 started me on this journey in March 2021. At first I thought I needed Canvas Data and either PowerBI or Tableau. Then I watched the Kansas State videos more carefully and realized that the data was available as a report . I could also see that these reports were being used to drive dashboards. Although I lacked PowerBI and Tableau, I stumbled into Data Studio in the newly acquired Google Workspace for Education. By late Mar...

Instructure Canvas and Data Studio dashboard for instructional coordinators

Image
The above is a prototype dashboard designed to provide instructional coordinators with insight in course performance both in terms of scores in a course and outcome performance using Instructure Canvas and Data Studio.  The data driving the dashboard derives from two Canvas administrative reports that are available as CSV files, the Grade Export table and the Outcome Results table. These are then imported each into their own Google Sheet which are then connected to Google Data Studio. The two tables are added to a blend as seen above. The join will be on the common fields of course id and section id.  The section ids appear to be unique and the dashboard was originally built on only a section id join. Without documentation that section ids are unique values the dashboards were updated with a join on the course id as a precaution. This may not be necessary. The dashboards include the ability to drill down to sections, hence the need for a join at the section level.  The co...

Using the CASE function in DataStudio to generate factors

Image
The college has six campuses with each campus in its own subaccount in the LMS. Attempts to build a dashboard that would output current score data by subaccount ran into the difficulty that the Grade Report CSV export does not provide information on the source subaccount for courses.  The only column with data from which the subaccount information is a section column. The section code suffixes indicate the campus on which the course is taught, and campuses are subaccounts. Thus the goal is to assign subaccounts (campuses) to courses. Here the campuses are effectively a data analysis factor.  A first attempt was to go after the low hanging fruit of setting up a control to display online or residential courses. All Online courses are in their own subaccount. Online courses have a section designation of /On where n is a single digit integer. At present there are no courses with more than nine sections in a subaccount. The CONTAINS_TEXT function looks for the /O in the section nam...