Posts

Showing posts from August, 2012

Enigma

Image
In SC 101 Health Science I try to liven up Fridays with surveys and activities. This Friday I jumped off from a side bar on managing stress by relaxing to music on page thirty-nine of Edlin and Golanty's Health and Wellness tenth edition . Prior to playing a musical piece I had the students measure their resting heart rate and complete a brief stress and tension survey I cobbled together by editing extant on line surveys. Before Enigma After Enigma Resting heart rate Before Enigma After Enigma Yes Sort of No Yes Sort of No My body feels tense all over. 2 1 0 2 1 0 I feel pressured because of my studies and tests. 2 1 0 2 1 0 I have a headache. 2 1 0 2 1 0 I have a nervous sweat or sweaty palms. 2 1 0 2 1 0 My muscles are tense. 2 1 0 2 1 0 My skin is itch

RipStik Linear Motion

Image
SC 130 Physical Science section 012 linear motion opted to use the sidewalk to the west of the B building this term. The catch is that the sidewalk has more slope than I anticipated. So I opted to go uphill, attempting to hold a constant swizzle against the rise. The chart suggests I was essentially successful. The data is linear enough to convince one of the linearity of constant velocity motion. Or constant swizzle motion.

Math curriculum support workshop number two

Image
On Friday August 24th a second in a series of work shops intended to provide support to the instructors at Madolehnihmw high school was held from 4:00 to 6:00 P.M. I was delayed in my arrival due to the addition of a college section from 2:00 to 3:00. I left the college at about 3:15 and arrived just a few minutes after 4:00 at MHS. After some discussion, the participants asked to have angles and trigonometry reviewed. The session covered a lot of ground and was very productive for everyone. The group decided to next meet on Friday 21 September at the same place and time. I owe thanks to the MHS team for being there late on a Friday and for the bananas! Sometime in October the larger math curriculum alignment group will meet.

Numeric information in graphic forms skills pre-assessment

Image
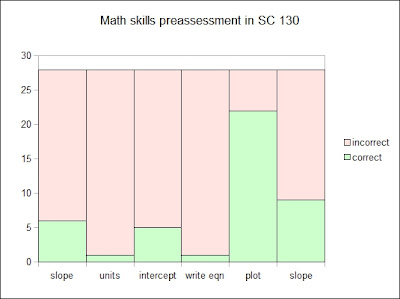
The second program learning outcome which SC 130 Physical Science addresses is "Students will be able to present and interpret numeric information in graphic forms." Twenty-eight students in physical science fall 2012 were given six questions which focused on this outcome. The preassessment was done on the first day of class. The following item analysis table indicates the number of students out of 28 answering a given question correct. Question Correct Calculate slope from line on graph 6 Determine units from axis labels 1 Determine y-intercept from line on graph 5 Write out the equation of line from graph 1 Plot xy data given a table labeled x, y 25 Calculate slope from line on graph 9 As seen in a report done last summer , performance on the preassessment this fall was weak. The strongest performance was on a plotting (x, y) points given data in a table. Twenty-five of 28 students complet

Social Media Survey

Image
A convenience sample survey was administered on the first day of MS 150 Statistics at the College of Micronesia-FSM to the 72 students attending that first day of class. Site Sp 09 Fa 09 Sp 10 Fa 10 Sp 11 Fa 11 Sp 12 Fa 12 FaceBook 0 9 12 46 62 54 70 70 Google+ 0 32 Bebo 17 41 27 37 42 20 19 25 MySpace 32 45 33 33 45 29 31 23 Twitter 2 7 11 Other 8 16 26 25 16 12 10 9 LinkedIn 0 6 None 9 13 10 8 8 4 3 0 Sample size n 54 74 58 66 72 61 73 72 Number of students with membership in the listed site by term Note that the columns do not add to the sample size as students can have multiple memberships. Percentage of students with membership in the listed site by term 

Adding X11 colors to standard.soc in LibreOffice.org Calc on Ubuntu

Image
LibreOffice.org Calc lacks a good selection of faded pastel colors that work well as cell backgrounds. To remedy this deficiency, I usually add the X11 colors to the standard.soc file in LibreOffice.org Calc. I presort the X11 colors by luminosity to push the high luminosity colors to the end of the list. To find the standard.soc color file on an Ubuntu rig, pop open a terminal using Ctrl-Alt-t. Then run sudo find -name standard.soc -type f On Lubuntu 12.04 there are two standard.soc files. /home/[username]/.config/libreoffice/3/user/config/standard.soc /usr/lib/libreoffice/presets/config/standard.soc The first is the one that contains both the LibreOffice.org standard colors and any custom colors one has added. The second is a preset file that apparently is overwritten on package upgrades. I use SciTE for editing, this package is available in the repositories. Nano would work, but the standard.soc file has no line feeds. I know how to add line feeds to SciTE which makes th

General Education Science Assessment Report 2009 – 2012

Image
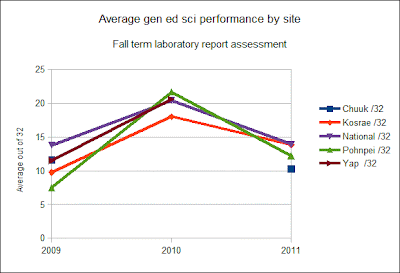
General Education Science Assessment Report 2009 – 2012 The general education science assessment has been performed for the past three academic years. Each fall a sample of laboratory reports was analyzed against a rubric. Performance factor score 4 3 2 1 Metric: Scientific Procedures and reasoning Accurately and efficiently used all appropriate tools and technologies to gather and analyze data Effectively used some appropriate tools and technologies to gather and analyze data with only minor errors Attempted to use appropriate tools and technologies but information inaccurate or incomplete Inappropriate use of tools or technology to gather data Metric: Strategies Used a sophisticated strategy and revised strategy where appropriate to complete the task; employed refined and complex reasoning and demonstrated understanding of cause and effect; applied scientific method accurately Used a strategy that led to comple