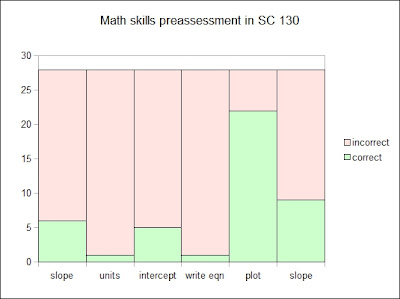
Numeric information in graphic forms skills pre-assessment
The second program learning outcome which SC 130 Physical Science addresses is "Students will be able to present and interpret numeric information in graphic forms." Twenty-eight students in physical science fall 2012 were given six questions which focused on this outcome. The preassessment was done on the first day of class.
The following item analysis table indicates the number of students out of 28 answering a given question correct.
| Question | Correct |
| Calculate slope from line on graph | 6 |
| Determine units from axis labels | 1 |
| Determine y-intercept from line on graph | 5 |
| Write out the equation of line from graph | 1 |
| Plot xy data given a table labeled x, y | 25 |
| Calculate slope from line on graph | 9 |
As seen in a report done last summer, performance on the preassessment this fall was weak. The strongest performance was on a plotting (x, y) points given data in a table. Twenty-five of 28 students completed this task correctly. The most common mistake was plotting (y, x). Both the data table and the graph were labeled with x and y, some students still reversed their plot. Given the table of data, nine out of the 28 students were able to calculate the slope. The median number of items correct per student was one. One question correct out of six.
| Stu. Score | Number with that score |
| 0 | 4 |
| 1 | 12 |
| 2 | 5 |
| 3 | 3 |
| 4 | 1 |
| 5 | 0 |
| 6 | 1 |
Four students obtained zero correct, 12 obtained only one correct, five students had three problems correct.
Note that every student in the course has had a mathematics course at the college, with 20 of the 28 having had MS 100 College Algebra. Three students completed MS 101 Algebra and Trigonometry, three completed MS 099 Intermediate Algebra.
For many majors MS 100 College Algebra is the terminal mathematics course. Twenty-three students either completed MS 100 or a higher course, yet their only retained skill is plotting (x, y) points on a graph. One student who completed MS 101 Algebra and Trigononmetry was unable to get even a single question correct. There was one perfect paper with six correct, that student had completed no math higher than MS 100 College Algebra.
The distribution of scores as a sum of the number correct was low on this preassessment.
The median does not show in the box plot above because the median score is one, which is also the 25th percentile. Four and six correct out of six represented unusual scores on this basic assessment of slope and intercept skills.


Comments
Post a Comment