Posts

Showing posts from May, 2014

Notes from the Northern Pacific Environmental Health Association Strategic Planning Meeting

Image
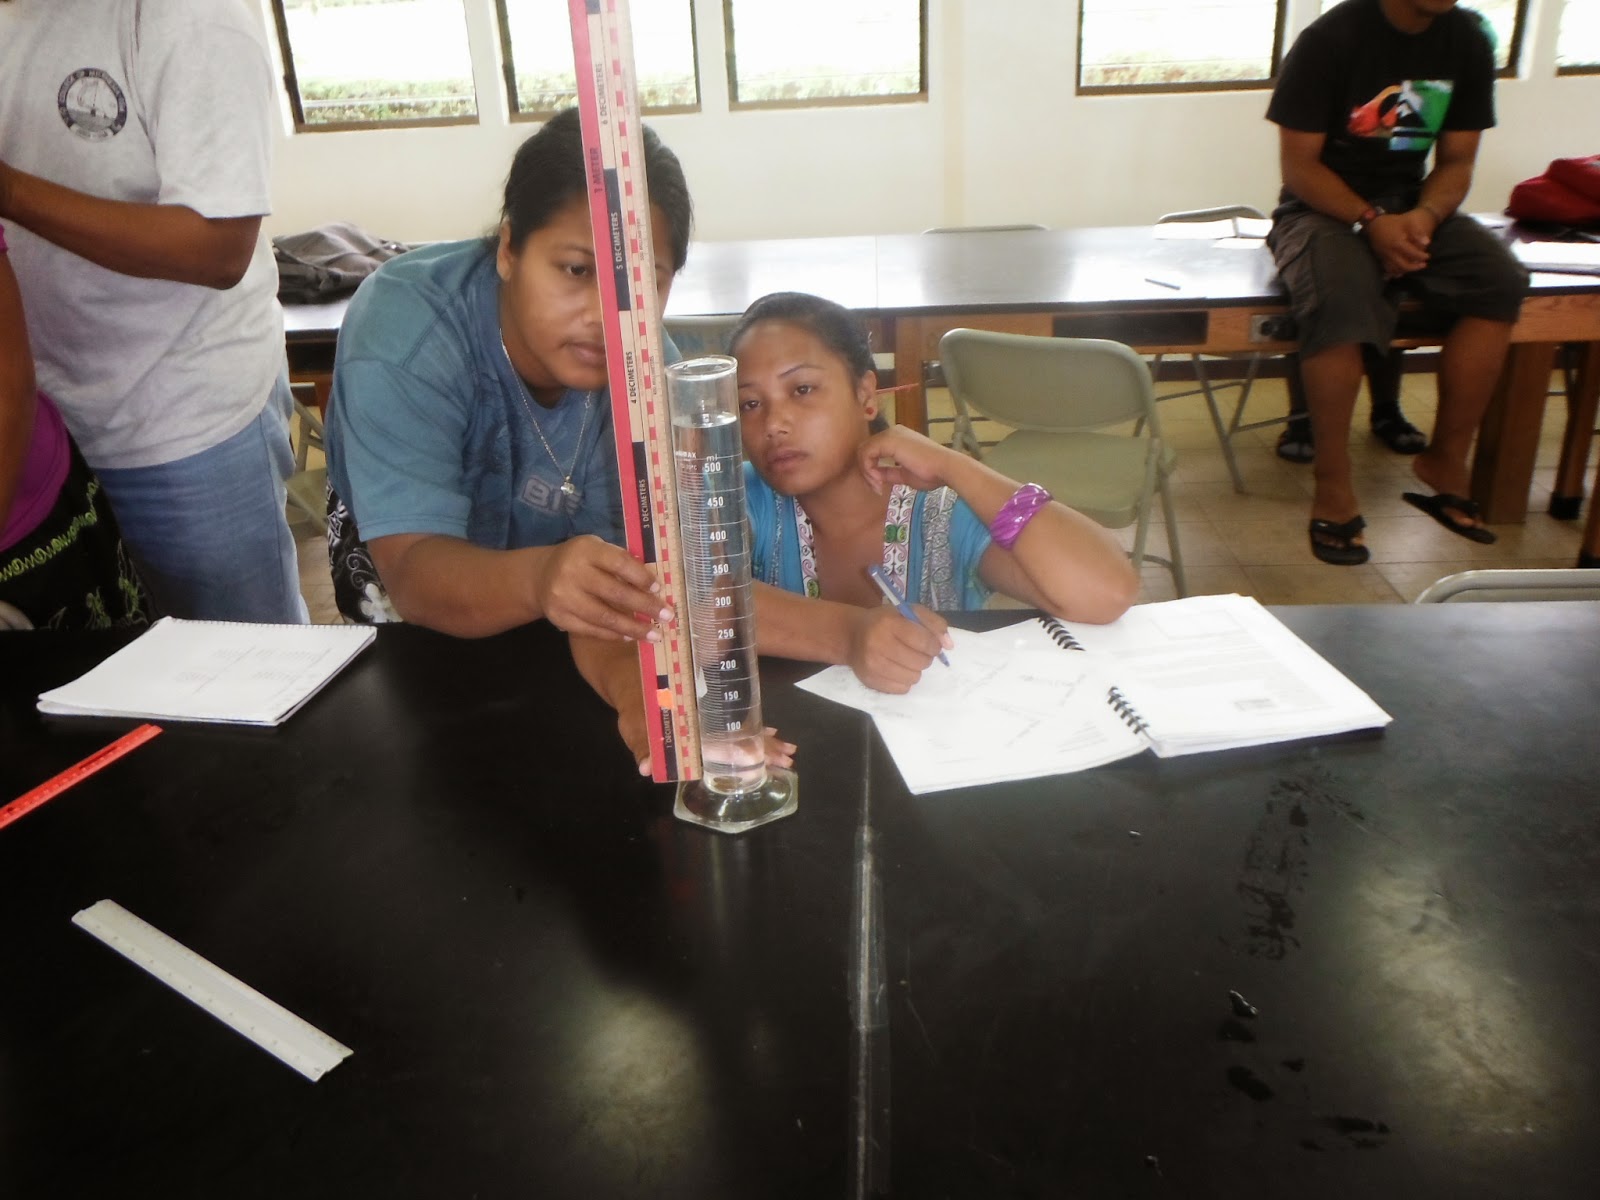
These are my own rough and unofficial notes from the Northern Pacific Environmental Health Association Strategic Planning Meeting held on Pohnpei in May 2014. There was a need identified to bring key actors together to develop a strategic plan. Environmental health touches on many areas – waste management, water, climate change, occupational safety. Consultants in health adaptation for climate change, specialists on vector borne diseases, specialists who advocate community based approaches. Environmental health has a WHO definition . Includes human health, quality of life, that are determined by chemical, physical, biological, social and psychosocial factors in the environment. Assessing, correcting, controlling, and preventing those factors in the environment that can potential affect adversely the health of present and future generations. Environmental health addresses all the physical, chemical, and biological factors external to a person, and all the related factors impac

Engrade assessment data report end of spring term 2014

Image
Although twenty-six instructors are registered with the Engrade administrative stub , only 21 were active users spring 2014. These 21 instructors served 895 students in 71 classes spring 2014. Engrade dashboard Engrade reports that of the 895 students, 211 students are failing classes.Engrade provides performance data across multiple terms for three broad performance bands. Engrade performance brackets The student performance numbers, which apparently reflect individual assignment performance rather than course level performance, indicates that 149 students are failing. Some of this difference from the 211 students may be due to the weighting of assignments in the class grade. 279 students (31%) have missing assignments. Missing work is likely to be a contributing factor to course failure. Student performance as tracked by Engrade The student performance bar chart suggests that spring 2014 relative performance was on par with spring 2013. Student performance a

Report on learning in MS 150 Statistics against the proposed outline

Image
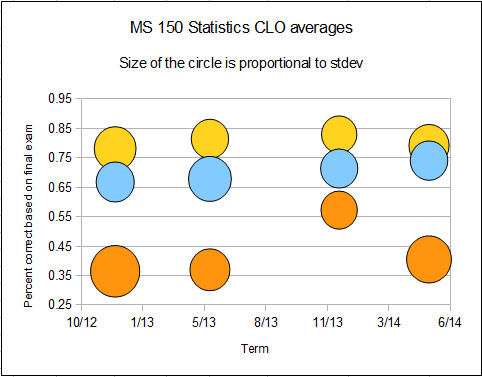
A revised outline has been proposed for MS 150 Statistics based on a concept that would align course outlines with the assessment systems in place at the college. The revision would see specific student learning outcomes move from the course outline to the course syllabus. The course outline would retain only course level student learning outcome, at one time termed general objectives and later general student learning outcome at the the college. The new outline proposes having three course level student learning outcomes. Students will be able to... Perform basic statistical calculations for a single variable up to and including graphical analysis, confidence intervals, hypothesis testing against an expected value, and testing two samples for a difference of means. Perform basic statistical calculations for paired correlated variables. Engage in data exploration and analysis using appropriate statistical techniques including numeric calculations, graphical approaches, and tests

Exploring physical science systems using scientific methodologies

Image
A proposed outline for SC 130 Physical Science includes the following three course level student learning outcomes: Explore physical science systems using scientific methodologies Generate mathematical models for physical science systems and use appropriate mathematical techniques and concepts to obtain quantitative solutions to problems in physical science. Demonstrate basic communication skills by working in groups on laboratory experiments and by writing up the result of experiments, including thoughtful discussion and interpretation of data, in a formal format using spreadsheet and word processing software. The second learning outcome serves, in part, the general education program learning outcome, "3.2 Present and interpret numeric information in graphic forms." Student performance against general education program learning outcome 3.2 was reported on in Numeric information in graphic forms skills pre-post assessment . The third learning outcome serves, in p

Writing improvement in physical science

Image
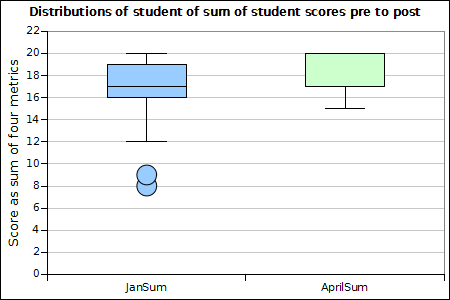
When I took over and redesigned SC 130 Physical Science in 2007 I had two focuses. The dual focuses were to put mathematics and writing into the core of the course. By building laboratories around mathematical models and having students write up the results of those laboratories in reports marked for content, grammar, vocabulary, organization, and cohesion, both goals were simultaneously achieved. A previous report looked at improvement in mathematical graphical analysis skills , this report looks at the improvement in writing. The redesigned course is intended to include support for the general education program student learning outcome 1.1, "Write a clear, well-organized paper using documentation and quantitative tools when appropriate." The course also now serves the second institutional learning outcome, "Effective written communication: development and expression of ideas in writing through work in many genres and styles, utilizing different writing technologies,

Numeric information in graphic forms skills pre-post assessment

Image
Underneath the focus on physical systems, SC 130 Physical Science is built on a foundation of connecting physical systems to their mathematical models and communicating the results in writing. Laboratory exercises lead to the writing of a full laboratory report that is marked for content, syntax, grammar, vocabulary, organization, and cohesion. The majority of the laboratories investigate systems that involve a linear mathematical relationship. Reports include xy scatter graphs, best fit linear trend lines, slope, and y-intercept analysis. The course outline includes the learning outcome, "Students will generate mathematical models for physical science systems." This serves a general education program learning outcome, "Students will be able to present and interpret numeric information in graphic forms," which in turn serves an institutional learning outcome for quantitative reasoning: "Students will be able to reason and solve quantitative problems from a w

Performance on MS 150 Statistics final examination

Image
Assessment is sometimes about repeating a set of measurements term-after-term to look at long term trends. In SC 130 Physical Science I have run an assessment of a program learning outcome focused on numeric information presented graphically for the past ten course terms. This provides longer term trend analysis and permits insight into term-on-term natural variability. These longer term studies are important and crucial to assessment. Assessment is sometimes seeing something tantalizing and swinging around to chase down a gut sense that something just happened inside a data set. MS 150 Statistics consists of three sections with up to thirty students per section. Final examinations stretch out over three days. By happenstance of the final exam calendar, each section is on a different consecutive day. The 8:00 section (m08) has their final at 8:00 on the first day of final exams. The 10:00  section (m10) is on day two at 10:05. The 9:00 section (m09) is on the third day at 8:00 in