Numeric information in graphic forms skills pre-post assessment
Underneath the focus on physical systems, SC 130 Physical Science is built on a foundation of connecting physical systems to their mathematical models and communicating the results in writing. Laboratory exercises lead to the writing of a full laboratory report that is marked for content, syntax, grammar, vocabulary, organization, and cohesion.
The majority of the laboratories investigate systems that involve a linear mathematical relationship. Reports include xy scatter graphs, best fit linear trend lines, slope, and y-intercept analysis. The course outline includes the learning outcome, "Students will generate mathematical models for physical science systems." This serves a general education program learning outcome, "Students will be able to present and interpret numeric information in graphic forms," which in turn serves an institutional learning outcome for quantitative reasoning: "Students will be able to reason and solve quantitative problems from a wide array of authentic contexts and everyday life situations; comprehend and can create sophisticated arguments supported by quantitative evidence and can clearly communicate those arguments in a variety of formats."
Twenty-five students in physical science spring 2014 were given nine questions which focused on this particular outcome. The preassessment was done on the first day of class.
Student performance on the pre-assessment was not just weak, the performance was weaker than the fall term 2013 performance on the same instrument. On five of the nine questions performance fell term-on-term.
SC 130 Physical Science is designed to address these mathematical weaknesses. The course has as one of its intents the placing of the mathematics into less abstract contexts. The concept is that the laboratory systems and data might provide cognitive hooks on which the students can attach a stronger comprehension of linear mathematical models.
Laboratories one, two, three, five, seven, nine, eleven, twelve, and fourteen involve linear relationships between the variables being studied. Non-linear relationships are also generated by some activities in the course. Although the students use spreadsheets to obtain the best fit trend line, the students were still working with concrete systems with variables that are related linearly.
The first nine questions of the final examination were either exactly identical to questions on the pre-assessment, or the questions were conceptually identical with changes only in the values. As measured by the number of questions answered correctly, performance was markedly improved on the post-assessment.
On the pre-assessment (n = 25) no student did better than correctly answering six of nine questions, and that was only one student. On the post-assessment (n = 28) eighteen of the students (64%) correctly answered six or more questions. Of the eighteen, five students answered all nine questions correctly on the post-assessment.
On the pre-assessment seven students answered all questions incorrectly including the inability to plot data points on an xy scattergraph. On the post assessment no student answered all questions incorrectly. The lowest number correct was a two, and every single student plotted data correctly on an xy scattergraph.
The score gains seen this term are on par with improvements seen in the past. In the past only six questions of the nine were asked. The chart shows performance across six terms on these six questions.
Each term the students start off consistently weak with the first quartile often being a score of zero and a median of zero or one. This poor performances makes even less sense in light of the student's academic background. This term 24 of the 25 students who were present on the first day for the pre-assessment had taken a 100 level math course. Sixteen students had taken and passed MS 100 College Algebra, five students had taken MS 101 Algebra and Trigonometry, two had taken MS 150 Statistics, and one had taken MS 106 Technical Math. The one student who had not taken a 100 level math course had not yet taken any math course at the college. At one time, these 24 students did know how to plot data on a graph, find the slope for a direct relationship, and determine the y-intercept.
On the post-test the median rises to four to five. This term the performance on the pre-assessment was weak than that seen fall 2013. The post-assessment continued to reflect these weaknesses with third quartile of five rather than six.
The number of students answers a particular question correctly also improved. There were nine questions, on each question student performance improved.
All nine concepts saw improvements, although only the question asking students to plot data on an xy scattergraph was answered correctly by all 28 students. Even after a full term of working with linear regressions and xy scattergraphs, there remain a few students who do not master the concepts.
The smallest success rate was seen for writing out the equation of a line. Students can successfully find the slope and intercept, but can still have difficulty writing out the equation of the line (slope-intercept form).
Although the course does not directly or intentionally teach students to plot points, determine slopes and intercepts (spreadsheets are used to plot data and find linear regressions to the data), the post-assessment (with problems solved using only a calculator, not a spreadsheet) indicates that the students have improved their capabilities in these areas. Physical science provides concrete cognitive hooks in the form of physical systems the students can see and manipulate. Physical science provides a framework, a structure, that organizes and makes meaningful abstract mathematical concepts.
The course continues to positively impact program learning outcomes as well as institutional learning outcomes on quantitative reasoning.
The majority of the laboratories investigate systems that involve a linear mathematical relationship. Reports include xy scatter graphs, best fit linear trend lines, slope, and y-intercept analysis. The course outline includes the learning outcome, "Students will generate mathematical models for physical science systems." This serves a general education program learning outcome, "Students will be able to present and interpret numeric information in graphic forms," which in turn serves an institutional learning outcome for quantitative reasoning: "Students will be able to reason and solve quantitative problems from a wide array of authentic contexts and everyday life situations; comprehend and can create sophisticated arguments supported by quantitative evidence and can clearly communicate those arguments in a variety of formats."
Twenty-five students in physical science spring 2014 were given nine questions which focused on this particular outcome. The preassessment was done on the first day of class.
Student performance on the pre-assessment was not just weak, the performance was weaker than the fall term 2013 performance on the same instrument. On five of the nine questions performance fell term-on-term.
SC 130 Physical Science is designed to address these mathematical weaknesses. The course has as one of its intents the placing of the mathematics into less abstract contexts. The concept is that the laboratory systems and data might provide cognitive hooks on which the students can attach a stronger comprehension of linear mathematical models.
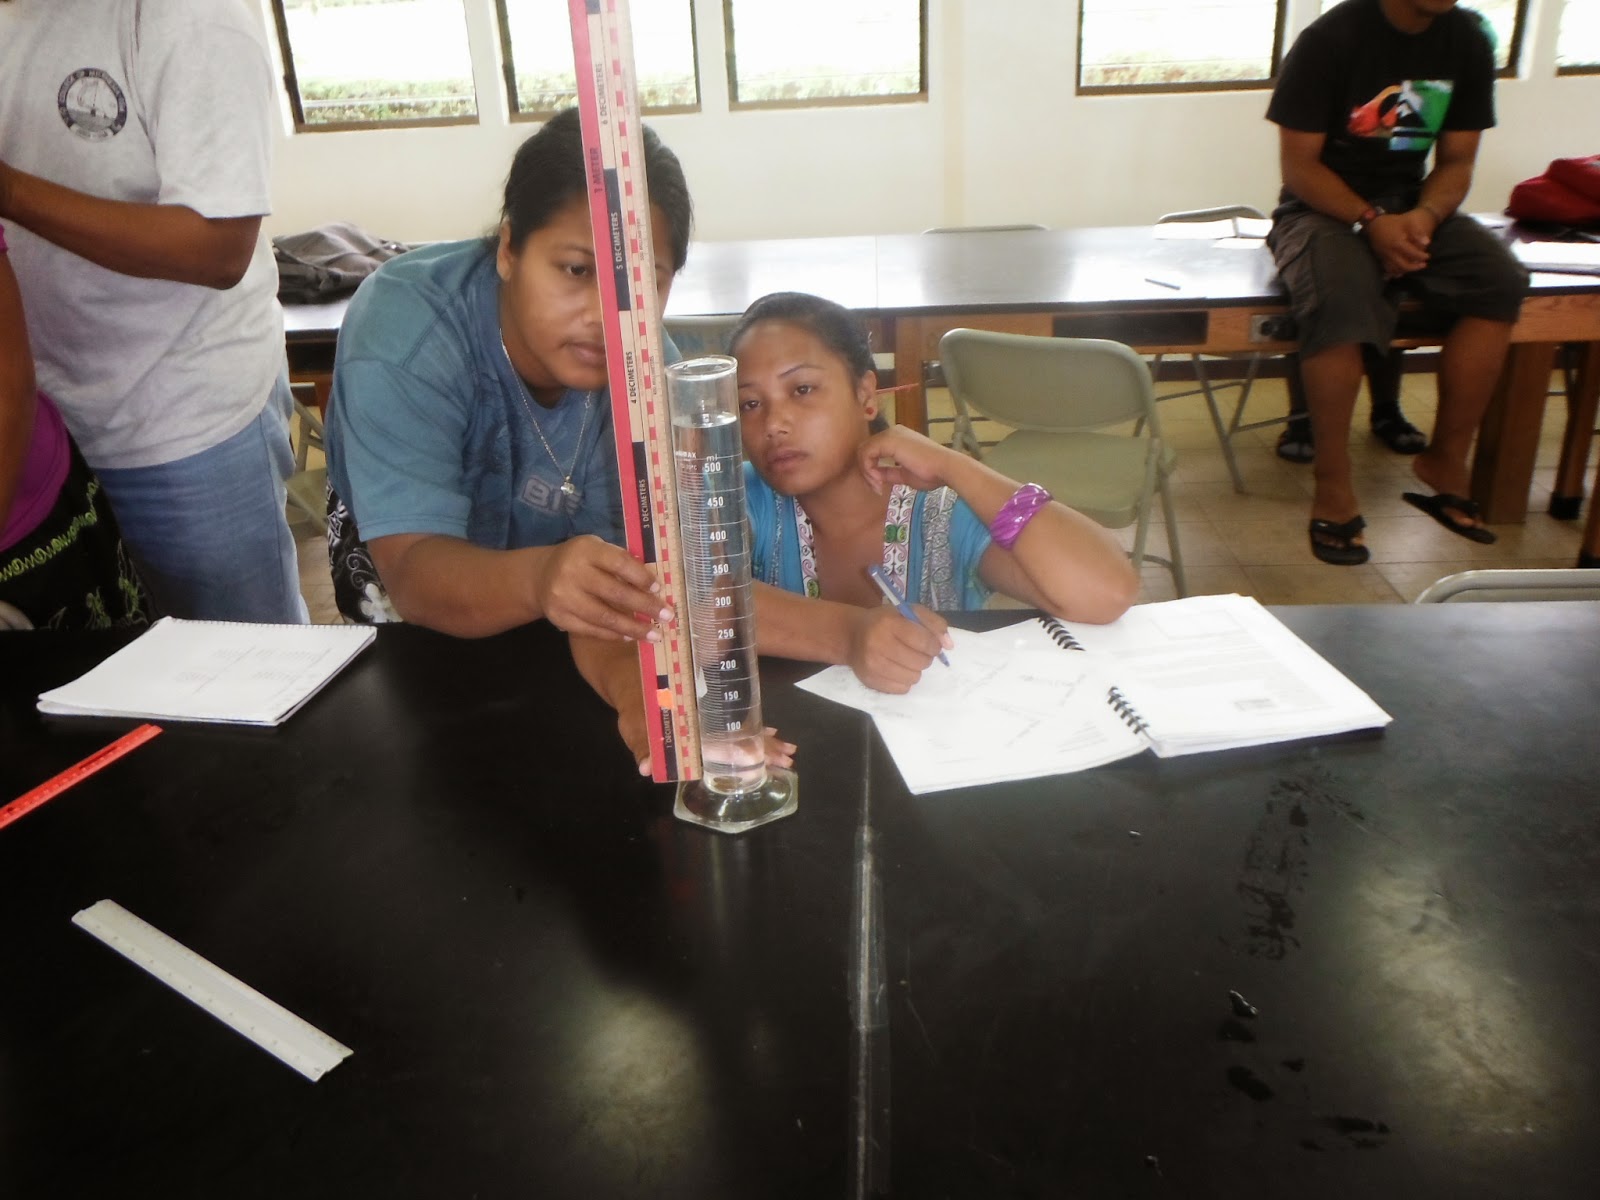 |
| Serlyn makes measurements of apparent depth which leads to a linear relationship with a slope near the index of refraction for water |
The first nine questions of the final examination were either exactly identical to questions on the pre-assessment, or the questions were conceptually identical with changes only in the values. As measured by the number of questions answered correctly, performance was markedly improved on the post-assessment.
 |
| Box plots of student score distributions on nine questions for pre and post-assessment spring 2014 |
On the pre-assessment seven students answered all questions incorrectly including the inability to plot data points on an xy scattergraph. On the post assessment no student answered all questions incorrectly. The lowest number correct was a two, and every single student plotted data correctly on an xy scattergraph.
The score gains seen this term are on par with improvements seen in the past. In the past only six questions of the nine were asked. The chart shows performance across six terms on these six questions.
 |
| Box plots of student score distributions on six questions held in common across six terms |
On the post-test the median rises to four to five. This term the performance on the pre-assessment was weak than that seen fall 2013. The post-assessment continued to reflect these weaknesses with third quartile of five rather than six.
The number of students answers a particular question correctly also improved. There were nine questions, on each question student performance improved.
 |
| Number of students answering a question correctly on the pre and post assessment. All questions saw a gain in performance. |
All nine concepts saw improvements, although only the question asking students to plot data on an xy scattergraph was answered correctly by all 28 students. Even after a full term of working with linear regressions and xy scattergraphs, there remain a few students who do not master the concepts.
The smallest success rate was seen for writing out the equation of a line. Students can successfully find the slope and intercept, but can still have difficulty writing out the equation of the line (slope-intercept form).
Although the course does not directly or intentionally teach students to plot points, determine slopes and intercepts (spreadsheets are used to plot data and find linear regressions to the data), the post-assessment (with problems solved using only a calculator, not a spreadsheet) indicates that the students have improved their capabilities in these areas. Physical science provides concrete cognitive hooks in the form of physical systems the students can see and manipulate. Physical science provides a framework, a structure, that organizes and makes meaningful abstract mathematical concepts.
The course continues to positively impact program learning outcomes as well as institutional learning outcomes on quantitative reasoning.


Comments
Post a Comment