Report on learning in MS 150 Statistics against the proposed outline
A revised outline has been proposed for MS 150 Statistics based on a concept that would align course outlines with the assessment systems in place at the college. The revision would see specific student learning outcomes move from the course outline to the course syllabus. The course outline would retain only course level student learning outcome, at one time termed general objectives and later general student learning outcome at the the college.
The new outline proposes having three course level student learning outcomes. Students will be able to...
The new outline proposes having three course level student learning outcomes. Students will be able to...
- Perform basic statistical calculations for a single variable up to and including graphical analysis, confidence intervals, hypothesis testing against an expected value, and testing two samples for a difference of means.
- Perform basic statistical calculations for paired correlated variables.
- Engage in data exploration and analysis using appropriate statistical techniques including numeric calculations, graphical approaches, and tests.
The primary mechanism for reporting on these student learning outcomes would be an item analysis of performance on items on the final examination. An earlier report examined the results of the spring 2014 term final examination.
Note that the third course level student learning outcome centers on authentic assessment of student capabilities when faced with raw data. This shift in the curriculum is reported on in a December 2012 article.
I have long felt that outlines should not be submitted to curriculum committee without some form of pilot data on what the assessment of learning will look like for those learning outcomes. Due to retention of final examinations and data from those examinations, I was able to go back and re-analyze the past four terms of final examinations in statistics against the three proposed student learning outcomes. Note that the final examinations are also available for inspection on line.
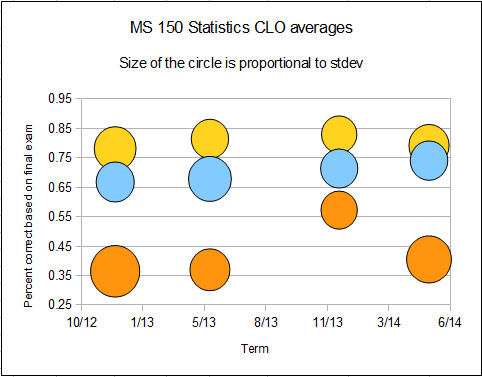
Performance on basic statistical calculations for a single variable averaged 80% success rates over the four terms. This value has been fairly consistent for far more than four terms. Given a straight forward calculation task using a spreadsheet, the students perform strongly.
Given a two variable linear regression and spreadsheet software, students averaged a 70% success rate over four terms.
Given raw data and questions with the requirement that answers be supported by appropriate but unspecified statistics, success rates fall to 43%. Yet in the real world this is the form in which data and data questions arrive. Data does not arrive along with the directions "Find the standard deviation, make a box plot, calculate a 95% confidence interval for the mean." Data arrives raw and unsorted, usually accompanied by questions as to meaning of the data and what actions should be taken based on the data. The open data exploration section of the final examinations tests these capabilities in the students.
The chart shows student success rate performance against the three proposed outcomes for the past four terms. The uppermost, yellow, circles are performance levels on single variable basic statistical calculations - course learning outcome number one. The middle, blue, circles are performance levels on two variable linear regression calculations - course learning outcome number two. The lowermost, orange, circles are the performance on the open data exploration. Note that the variation in performance is principally due to differences in the marking schemes term-on-term. To some extent the open data exploration is not comparable across terms due to differences in the marking schemes.
Student success rates on these three student outcomes can be measured. The three outcomes are comprehensive of the material covered in the present course. The proposed outline will well align with the present assessment systems while providing data to the instructor by which to improve the course and to close the loop.


Comments
Post a Comment