Cubic bezier sine wave in SVG
In the past I generated the Scalable Vector Graphics path for a sine wave by using a sine function and inputting x values.
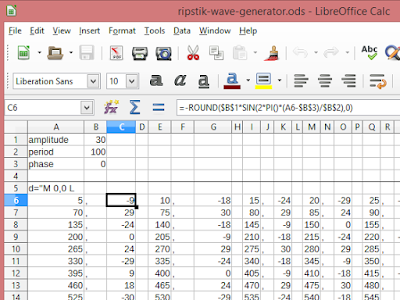

This summer I found that a cubic bezier could generate a cosine curve using just the points at the crest and trough, with control points at 0.1875*wavelength and 0.3125*wavelength. Those values were visually determined, not mathematically obtained.

The result is a smooth cosine wave of any combination of wavelength, frequency, and amplitude. A transform="translate(kπ,0)"can then move the cosine curve horizontally to generate a sine wave. Masks can be used to hide unwanted portions.
The cubic bezier routine can be seen in the code underneath question number one on my test five for the summer session. A transformed version that appears to be a sine wave was deployed in a similar question, question 21, on the final.

The difficulty with this approach is that the crests and troughs become unsmooth at combinations of high frequencies and high amplitudes. I had to increase the sampling density along the x-axis to smooth out the crests and troughs, which led to very large blocks of coordinates in the path command.


The result is a smooth cosine wave of any combination of wavelength, frequency, and amplitude. A transform="translate(kπ,0)"can then move the cosine curve horizontally to generate a sine wave. Masks can be used to hide unwanted portions.
The cubic bezier routine can be seen in the code underneath question number one on my test five for the summer session. A transformed version that appears to be a sine wave was deployed in a similar question, question 21, on the final.


Comments
Post a Comment