An official holiday on Tuesday and an unofficial holiday on Thursday may have contributed to decreased engagement as measured by page views on the Instructure Canvas platform.
Click to enlarge
While page views are down from week 14, the week 15 Tuesday national holiday had the same level of engagement as the day before, Monday on week 15. There is no obvious indication that the holiday impacted page views negatively, page views are down across week 15.
Other metrics on the platform were either stable or showed small amounts of growth into week 15.
Assessment
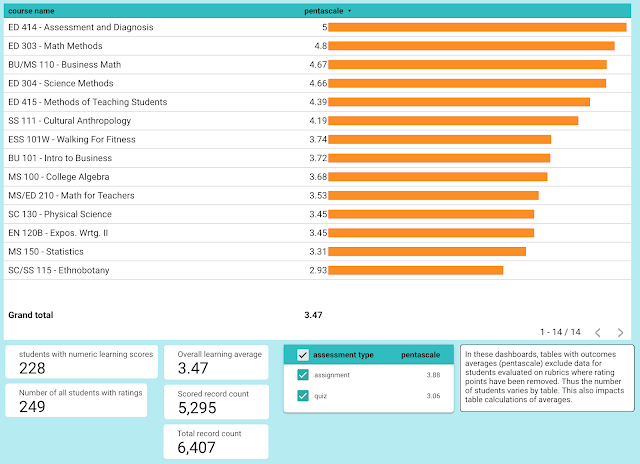
This week a brief look at learning as disaggregated by course and the relative impact of outcomes assessed by items on quizzes and tests versus outcomes assessed by rubrics attached to assignments.
Learning outcome assessment against a five point scale for courses reporting course learning outcomes. Week 15 saw 373 records added to the learning outcomes report.
Of the fourteen courses reporting learning, only four (29%) are using quiz question banks attached to course learning outcomes from the institutional bank of course learning outcomes. Quizzes and tests, however, are generating 3905 of the 6407 total records (61%).
Removing the contribution from quizzes leaves 2502 records generated by assignments with attached rubrics. Some faculty have chosen to strip the points out of the learning outcomes rating scale, leaving only 1390 scored records for 193 students.
Underneath the numbers are data stories. The MS 150 Statistics course has a learning outcome average of 2.8 as measured by tests and quizzes. In MS 150 Statistics the only assignments evaluated by a rubric are open data exploration mini-projects. As measured by this more complex activity, the learning outcome average is up at 4.28. The strength of Canvas is that learning data is flowing from actual in-class artifacts. This allows one to perform explorations such as the above, explorations that are simply not possible at present in TracDat, at least not as currently configured and used. As a faculty member, I am doing no extra work to generate this learning data, none other than using the outcomes already available in the institutional bank of course learning outcomes. The dashboards can accessed by other instructors, allowing instructors to identify areas of learning strength and weakness, enabling faculty to close their own assessment loops.
Dashboards
Course learning outcomes fall 2021
General education outcomes 2021.3
Course learning outcomes assessment fall 2021 dll sis
Pentascale average time series fall 2021
Learning outcome ratings on assignments only 2021.3
Spectacular dashboards: a cautionary tale
Reports
Week one: Assessment available at sunrise on a new term
Week two: SIS disaggregation and a deep dive into mapping decisions
Week three: SIS disaggregation and another dive into mapping complexities
Week four: A focus on subaccounts and campuses
Week five: Pivot of state of origin versus gender
Week six: Dashboards can be focused
Attendance versus performance in statistics
Week seven: Outcome performance at the course level and other dashboards
Week eight: Update at midterm
Week nine: A look at score and grade distributions
Week ten: Grey goo revisited
Week eleven: Update on the numbers
Week twelve: Page views collapse
Week thirteen: Holiday impact or disengagement?
Week fourteen: Some indications of reengagement
Week fifteen: A look at courses ranked by learning


Comments
Post a Comment