Posts

Showing posts with the label R

From Canvas outcome results to R to flexdashboard
Image
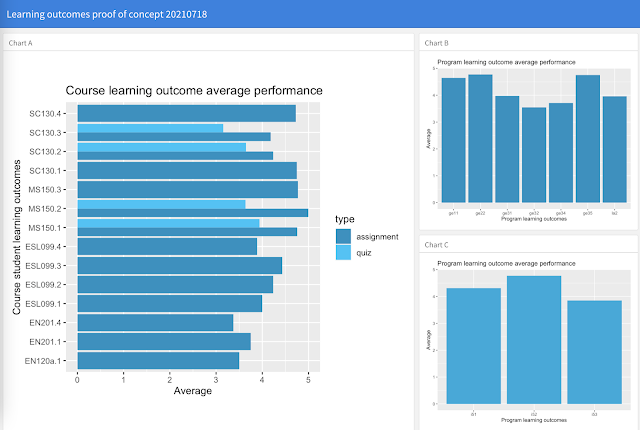
A week ago I began a journey to explore the admin outcomes report from Instructure Canvas. I began by struggling my way through to a chart , learned to select, mutate, and join with dplyr, and then connected two dimension tables separated by a main data table where each dimension table had a different primary key. This last step took me beyond where Google Data Studio can go at present - Data Studio must have a common key across all joined tables.  Today I took the results from the week and built a static dashboard of some of the results using flexdashboard. The code driving the dashboard was cleaned up including dropping comments and simplifying by some up front ETL work on the underlying tables, including the removal of a number of variables. The only error today was forgetting that to build the web page one has to issue an rmarkdown render command, rmarkdown::render("outcomes_20210718.Rmd") This week also included my own first foray into watching videos to learn a new s...

Canvas and R outcome results join to SIS and aggregating outcome dimensions

Image
One of the reasons for working in Google Data Studio is that Data Studio is free. The most crippling limitation is that all tables must share a common key. This is a problem for the Canvas outcome results analysis. The learning outcome names (clso in my R code below) are aggregated by a dimension table with program and institutional learning outcome mappings. The only connection back to a student information system dimension table, however, is via IDNumber. Data Studio dashboards can display either performances aggregated by course, program, and institutional learning outcomes, or performances aggregated by course learning outcomes and SIS variables. Data Studio cannot report SIS variables against program or institutional learning outcomes. Such as gender versus program learning outcomes (pslos). One could pre-process to build a single massive union table and dump that into Data Studio, but if one has software that does that already, what would be the point of using Data Studio? Obviou...

Instructure Canvas outcome results R dplyr select mutate left_join

Image
This is a second day of looking at using R to explore the Instructure Canvas admin outcome results file. In my earlier exploration I tackled using group_by and ggplot to display student learning outcome averages by course level learning outcomes. My intent in a second day of work was to perform some extract, transform, and load (ETL) operations up front on the actual CSV export file from Canvas, rename their space punctuated variables, rescale the outcome scores to all be on a five point scale, join the table to a dimension table on a left outer join, and then generate essentially the same graph as I had generated earlier.  Canvas exports tidy data in the outcome results file which makes possible the use of readr and dplyr from the tidyverse package. That the data is tidy apparently saves weeks of potential cleaning work . Beyond basic file loading and ggplot work, the following code uses dplyr select to both select and rename eight of the thirty variables in the original CS...

R and RStudio first days

Image
Work I have been doing in DataStudio and a recent article on PowerBI, Tableau, and Shiny, caused me to take another look at R and RStudio . As an instructor of statistics I am more than keenly aware that R is the go to tool for statistics and data exploration. This is not my first foray into R, but this time the journey is driven by work to explore producing student learning outcome dashboards.  The student learning outcomes data is tidy data and that makes use of the Tidyverse package possible. Still, the journey is far more challenging than a spreadsheet or business intelligence dashboard. Even once I have a working line of code, there are pieces of the code line that I simply do not understand. This is something I am accustomed to when tackling software, but some of the more baffling aspects do not seem to be explained and do not resolve themselves in my mind once they are working. I am more used to languages that once the code is working, I can then see why the code is work...