Posts

Showing posts with the label mathematics

Desmos regression tool

Image
Demos graphing calculator on the web (desktop, laptop) includes a regression tool. The tool is not yet in the mobile app. To use the tool on a mobile device use the mobile browser to open: https://www.desmos.com/calculator The regression tool works with tables. The tool is an icon at the upper left side of the table. The tool opens as a linear regression. Other regression options are available. To the right of the equation is an icon that copies the equation out to a new line. Editing that to f(x) notation results in a function that accepts inputs. Note that the above was done on mobile device using the mobile browser, not the Desmos app.  The graph above was autoscaled using the autoscale on the table.
Desmos geometry

Image
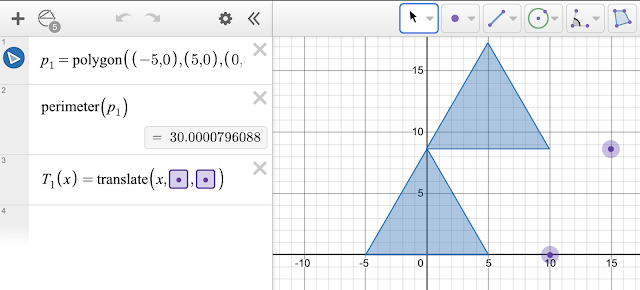
I never know quite what to do with the advances in mathematical tools, I just know that mathematics education stands at the edge of vast new technical capabilities. One of the tools I actively use, Desmos graphing calculator, has released a new version of their geometry calculator.  Desmos geometry Drag a purple dot on the graph to move the translation of the triangle around the graph. A more advanced demonstration is of maximizing the area inside a rectangle for a fixed perimeter done by Desmos. Maximize the area of a rectangle Drag the blue dot C until the maximum value for the area appears. How does that relate to the red coordinate displayed along the parabola? These tools open not only whole new ways to explore mathematics, these tools provide the capability to explore things that one could not previously explore. Such as an analysis of the conduction rate of water in celery xylem in a botany course laboratory. Celery conduction rate analysis But the students did not cut their cel

WolframAlpha, ChatGPT, and Desmos 3D

Image
For the above expression WolframAlpha offers the result seen above, choosing to simplify only by removing the cube root of 64.  Further down WolframAlpha offers the more simplified result seen above, but with the caveat that x and y must be positive. Yet the this is an odd root expression. Negatives "under the radical" are not imaginary.  I asked ChatGPT to weigh in on this. As seen above ChatGPT, known to sometimes commit mathematical errors, concurs that x and y do not have to be positive.  I then asked ChatGPT to simplify the same expression and ChatGPT went straight to the correct answer with no caveats. I say that round went to ChatGPT.  Desmos 3D visually demonstrates that both x and y can be negative.  All of the above screenshots are from a budget cell phone. There is deeper question underneath this single example. In algebra classes students are still being taught to simplify expressions such as the above

Pre-assessment of linear equations knowledge from graphical data

Image
Five students in SC 130 Physical Science were given a pre-assessment of their understanding of linear equations which focused on the interpretation of graphical and tabular presentations. Four of the five students had completed MS 100 College Algebra, the remaining student had completed MS 099 Intermediate Algebra.  Three students either left questions blank or provided wrong answers to every problem. Two students successfully answered six and eight of nine questions respectively. These are bright young students who have had at least twelve years of mathematics including high school algebra and collegiate math courses. The one student in MS 099 Intermediate Algebra was the student who answered six of nine correctly. In some sense, that the level of mathematics did not predict success is an indictment of the failure of the mathematics curriculum to teach mathematics. And when asked if they like math class, only two students responded that they did. Most students are only all too happy t

Preassessment of graphical math skills in a physical science course

Image
Twelve of eighteen students completed four preassessment graphical math skills questions. All twelve students have completed MS 100 College Algebra. A subset of the students have completed MS 101 Algebra and Trigonometry. The first question explored the early skill in xy scattergraph graphing, the correct plotting of an (x ,y) coordinate. Only 8 of 12 students answered this correctly, with two students selecting a point that was not simply a reversal of which number is x and which number is y. When asked to determine the slope from a line on a graph, as seen above, only seven of the students were able to answer the question correctly.  Identifying the y-intercept also saw a 58% success rate. For students who have completed college algebra and a relationship that is a direct relationship, this should be a surprisingly weak result.  All twelve of the students were able to answer the last question correctly. The students were able to infer which line on a graph derives from a table of dat

Pre-assessment of mathematical skills for students enrolled in a physical science course

Image
In August 2020, eighteen students enrolled in a hybrid online and residential physical science course completed an unproctored pre-assessment of mathematics skills consisting of the follow four questions. Coordinate identification multiple choice 1. Which of the points above is at the coordinate (3,1)? Fill in the blank slope calculation for a line with coordinates displayed 2. For the graph seen above, what is the slope of the line? A fill in the blank question. 3. For the line on the graph shown in the question above, what is the y-intercept for that line?  Also a fill in the blank question.  Matching data in a table to the correct line on a graph, multiple choice 4. Which line on the graph matches the data in the time versus distance table? All eighteen students had completed and passed either MS 100 College Algebra or MS 101 Algebra and Trigonometry, with six of the eighteen completing MS 101 Algebra and Trigonometry. The math presented above is considered pre-requisite skills to M

Pre-assessment on graphical mathematics skills among physical science students

Image
A pre-assessment in mathematics skills was administered to 23 students in SC 130 Physical Science on the first day of class. The pre-assessment differed from prior terms. This term the first question more no longer used a density of soap example. Instead the graph and questions referred to an algebraic xy labelled scatter graph. Question two was also simplified with the answers to 2e and 2d being able to be read from the table directly rather than calculated from the equation of the line. This term the slope formula and point-slope form were not provided. 1. Answer the following questions based on graph one.  a. __________ What is the slope of the line?  b. ______________ What is the y-intercept of the line?  c. y = _________ x + __________ Write the y = mx + b slope-intercept equation for the line. 2. A student rolled a ball along the sidewalk measuring the time and distance that the ball rolled. The data is recorded in the table below.  a. Plot the data on graph two.  b.

Pre-assessment on graphical mathematics skills among physical science students

Image
A pre-assessment in mathematics skills was administered to 18 students in SC 130 Physical Science on the first day of class. The students were unaware of the pre-assessment and thus were taking the pre-assessment without any preparation. The 18 students had all completed MS 100 College Algebra, MS 101 Algebra and Trigonometry, or MS 150 Statistics. The level of the mathematics on the pre-assessment was material found in high school algebra one. Highest math class taken Although the strong majority of the students who reported taking a mathematics course reported having had a college level mathematics course, overall performance on the pre-assessment  was weak. Performance by item on the pre-assessment n = 18 Calculations of slope and intercept were unusually low against historic performance levels. Students showed skill only in plotting points. Note that students did better on calculating a y-value given an x-value and calculating an x-value given a y-value than they

Numeric information in graphic forms skills pre-assessment

Image
Underneath the focus on physical systems, SC 130 Physical Science is built on a foundation of connecting physical systems to their mathematical models and communicating the results in writing. Laboratory exercises lead to the writing of a full laboratory report that is marked for content, syntax, grammar, vocabulary, organization, and cohesion. The majority of the laboratories investigate systems that involve a linear mathematical relationship. Reports include xy scatter graphs, best fit linear trend lines, slope, and y-intercept analysis. The course outline includes the learning outcome, "Students will generate mathematical models for physical science systems." This serves a general education program learning outcome, "Students will be able to present and interpret numeric information in graphic forms," which in turn serves an institutional learning outcome for quantitative reasoning: "Students will be able to reason and solve quantitative problems from a wi

Site swap notation

Image
Again this term I followed the path laid down the past two terms - to put up a correctly labelled 3 site swap and then ask if the students understood the diagram. I then put up a 51 pattern. I left space on the right end and asked students what comes next, an L or an R? Which color? Why? The students were able to answer these based on the pattern already set up on the board. I digressed into asking for the expansion of (x + 1)(x +1) and after an initial x² + 3 answer eventually was told that x² + 2x + 1 is the solution. I asked the class what this means, this x² + 2x +1, but the class was non-responsive. I then showed that if a square piece of land has a side length of x and the side lengths are increased by one, then the new property is x² + 2x +1 in area. I did this graphically. I noted this was just abstract symbols on a board being manipulated. Then I ran a 342 swap in what was still an abstract system on the board. I pointed out that both symbolic manipulations on