Desmos geometry
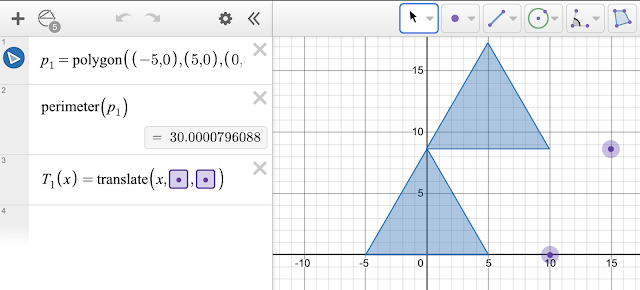
I never know quite what to do with the advances in mathematical tools, I just know that mathematics education stands at the edge of vast new technical capabilities. One of the tools I actively use, Desmos graphing calculator, has released a new version of their geometry calculator.
Drag a purple dot on the graph to move the translation of the triangle around the graph. A more advanced demonstration is of maximizing the area inside a rectangle for a fixed perimeter done by Desmos.
Drag the blue dot C until the maximum value for the area appears. How does that relate to the red coordinate displayed along the parabola?
These tools open not only whole new ways to explore mathematics, these tools provide the capability to explore things that one could not previously explore. Such as an analysis of the conduction rate of water in celery xylem in a botany course laboratory.
But the students did not cut their celery to the same length. Desmos 3d lets us plot the time for conduction, length, and rates in a 3d plot. By dragging the cube we can view each variable versus each other variable and look for patterns, if any, between pairs of variables. This is a contrived example with a dependent z-variable.
And the above doesn't touch on other mathematical engine apps such as WolframAlpha, PhotoMath, Gemini... If you are wondering about the last one, Gemini is now integrated into Google.
Gemini is Google's homegrown AI engine and search results can now include Gemini generated headers. Welcome to 2024.


Comments
Post a Comment