Posts

Showing posts from August, 2023

Acceleration day three

Image
The day started on high altocumulus clouds at sunrise.  Laboratory three opened with an overview of the past work on velocity and acceleration. Laid out this way, Wednesday is just the week two equation d = v₀t plus the Monday week three equation of d = ½at² resulting in d = ½at² + v₀t. Perhaps the idea of v₀ should be emphasized in week two? Memichin drops and times while Stella records. This term I encouraged two member teams.  Ian drops and times while Pevirleen records data. Renae and Alathea set up to gather data.  The class has health career opportunities students visit to view the periodic table. The area west of the classroom is undergoing changes.  The right is the future teaching and learning health clinic. Power lines had to be rerouted due to the building. Memichin Siniann working at the five meter mark. Sometimes physical science is fun. Sinia

Healing plants

Image
On Tuesday the class went for a walk in Paies. Photos were not attempted and rain shut down photos at the bridge. Construction rerouted the class first up to road to see Hibiscus tiliaceus, Glochidion ramiflorum, Cordyline fruticosa, and Macaranga carolinensis. Then we headed up into Paies. We were dry until rain caught us at the bridge.  Support for this walk consisted of an online handout and, new this term, a presentation . In the past the handout was sufficient. Students might not remember the name of a plant, but once they saw the local name on the list, they recalled which plant that was. This is no longer the case. The loss in knowledge is nothing short of staggering. The presentation includes images of the plants along with the local names. Perhaps this needs to be built out into a complete flora.  On Thursday the students presented. This term I opted not to photograph each presenter. I only took a few photos of perhaps more uncommon presentations. Multiple students brought Mo

Acceleration day two

Image
The subtheme of running with three meter lap distances was carried over into today with surprisingly good results. Prior to class I marked off three meter segments on the uphill into the LRC. I did not, as I have in the past, mark a ten or eleven meter mark.  Zero was in the traditional location on the left.  No marks were made at ten and eleven meters, only a new line up at 12 meters. Historically, no run has attained twelve meters. The class started in A101 where I laid out the table seen on the left. A test run at 11:45 AM had failed producing only five times. I had missed two timing marks. The right side was done upon return from the field. The class got out to 12 meter marks at 12:09 and was back in the room by around 12:25.  Desmos Knowing that the timing is complex, this term I kept a stopwatch and took times myself. I also distributed timers so others could practice timing my run. The day was exceptionally set and rainy. My Hoka Challenger 7

Statistics week three: Charts and nominal level histograms

Image
This term I preset a spreadsheet to introduce charts in chapter 3.1. The sheet included a table for the students to practice on, and practice they needed. CA 100 give short shrift to creating charts in spreadsheets. In addition, many students had not taken CA 100 yet. Here a student practices sorting the second column in descending order.  On Friday I went all in on blue including the use of blue post-it notes for the students to write their favorite color on. I went with blue over black on top of green with red underneath. I gave one student a list of the colors in order that I expected to see (two post-its, the top one covering my answers). To say I failed is an understatement. Not only did black best blue this term, but a new color leapt into the top four, one that sits solidly down in seventh place on the all time list. The results did allow coverage of the mode not being 1 but rather black. The sample size is the sum of the frequency data. Google Sheets pulled a new A

Acceleration day one

Image
Monday I tested a new approach to the opening RipStik acceleration run. Taking the three meter concept into week three I added only a 1.5 meter marker between 0 and 3 meters. Then I aimed to remain slow into the 3 meters marker, minimizing acceleration, possibly not accelerating except for the post push off at the start. Ahead of class I tested the concept and the result was no less reasonable than the prior terms where I used an increasing set of distances. I knew that there was a minimum stable speed down around 0.5 m/s below which two factors come into play. One is that the board is much harder to balance on - a stability issue. The other is that the board "stalls" on the smallest surface imperfection below around 0.5 m/s, the board simply has no momentum, the relative force of surface imperfections and friction are sufficient to stop a board moving below 0.5 m/s. That means a smooth increase to 0.5 m/s is not feasible, not possible. Desmos The test run well su

Canvas analytics week two fall 2023

Image
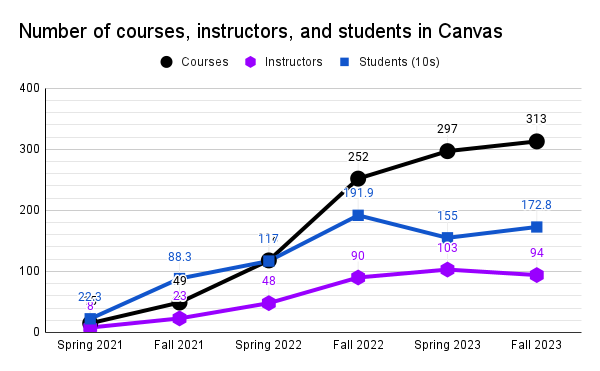
 The number of courses, instructors, and students have increased since week one. The increases are small, in part a result of course add/drop processes. The drop in the number of instructors may reflect in part vacancies that have developed and remain unfilled in a number of divisions across the system. Preliminary Canvas platform usage statistics. The unpublished courses still includes eleven courses with ten or more students listed as being enrolled. None of the published courses without activity have ten or more students. The highest enrollment for courses published without activity is seven students. These are likely to be courses that were cancelled due to low enrollment.  Institutional dashboard Systemwide the grade distribution is as is usually seen early in the term. The chart is displaying the number of scores in a particular score decade, not the number of students. Displaying the campus with the lowest median score indicates a statistically normal distribution with a right t