Posts

Showing posts from August, 2021

Canvas analytics and assessment data week two fall 2021

Image
  Week two saw upticks in the number of courses being served by Instructure Canvas as well as in the number of instructors and students active on the platform. Systemwide, Canvas delivered 1293 assignments and 150 discussions in the second week of classes.  Page views provides a snapshot of platform activity for all users. Canvas was most active on Mondays, Tuesdays, and Thursday. As seen in the past, on Friday activity levels on the platform tend to drop, falling to their lowest levels on Saturdays. Traditionally Saturday is a family day for housework, gardening, farming, fishing, and recreation. The single in-term Sunday that has occurred showed activity levels on par with the prior Friday.  At the end of the first week of classes there were 451 outcome evaluation events recorded on the platform. In week two the outcomes dashboard documents 1,065 outcomes evaluation events. These events include rubrics with outcomes from the institutional bank of course learning outcomes being mark
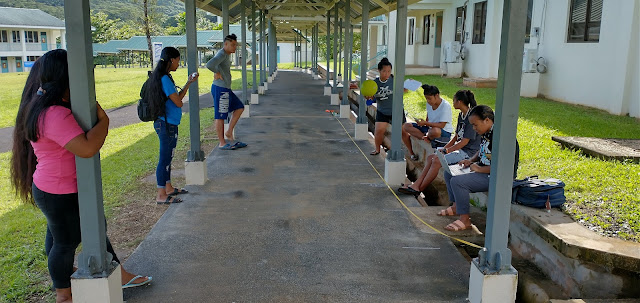
Linear velocity with a four square ball

Image
In a return to an earlier version of the laboratory, a four square ball was rolled slow, medium, and fast across markings at one meter, two meters, and three meters for each speed respectively. The morning set up, tape measure on the right. Four square ball coming back in from a run Four square ball inbound to distance equals zero marker ahead at the next post, timing started there.  Some students working in the field entered data into Desmos from chronographs as the data came in. Mercedes enters data, Derisalynn on timing In the morning the fast ball was timed at four meter intervals Johannes reads values on the chronograph Destiny Grace records data while Herna reads times. Destiny is a second gen student for me. Melrose records data while Mikie reads times This laboratory actually went better than I had recalled. I bowled for both sections. A two handed push produced reasonably slow speeds that were perhaps a tad higher than historical values, but the extra oomph also saw the ball

Canvas analytics and assessment data week one fall 2021

Image
The following are some preliminary week one data from Instructure Canvas analytics and outcomes assessment at the college. This data is only for those faculty and students using Canvas.  Fall term 2021 saw an expansion in the number of courses, instructors, and students using Canvas. The number of assignments set up by the end of week one fall 2021 exceeded all of the assignments set up for the whole spring 2021 term.  Term-on-term summer 2021 versus fall 2021 has seen nothing short of an explosive rise in the number of page views. Page views have increased by a factor of 26, that is a 2600% growth in page views. The numbers above comport well with the plan originally outlined in May 2021.  Perhaps most exciting for me personally is that assessment data is already available. Only nine course learning outcomes in four courses, but to have any data before the end of the first week of class has come to a close, well I find that stunning.  The course with no data has data, but the data is

Laboratory one and the density of soap

Image
Laboratory one launches the quest to demonstrate that the mathematics not only describes a system but predicts what a system will do. The laboratory opens with my reading of two quotes. La filosofia è scritta in questo grandissimo libro, che continuamente ci sta aperto innanzi agli occhi (io dico l' Universo'), ma non si può intendere, se prima non il sapere a intender la lingua, e conoscer i caratteri ne quali è scritto. Egli è scritto in lingua matematica,... -  Galileo Galilei  which might be translated as: [Science] is written in that great book which ever lies before our eyes - I mean the universe - but we cannot understand it if we do not first learn the language and grasp the symbols, in which it is written. This book is written in the mathematical language,...  and a second quote For a physicist mathematics is not just a tool by means of which phenomena can be calculated, it is the main source of concepts and principles by means of which new theories can be created... .

Canvas modules structure and pacing information

Image
 The following are some examples of Module structures I use in my Canvas courses. Statistics is structured around chapters in the textbook. The textbook was developed by me between 2000 and 2007, with updates in the following years. This allowed me to move the textbook chapters into Pages in Canvas. Pacing in statistics is set by daily assignments and regular tests. Each has a date attached. Students are kept informed of upcoming assignments in a weekly message to all students. Text headers provide information on chapter and section. The video "play" button icons are just emojis in the title for those external URL links.  Physical science is build around a weekly schedule with a unit topic per week. Again, a textbook developed over the years was moved into Canvas Pages to provide ease of access for students, many of whom have only a mobile device. Pacing is set by laboratory report due dates and quiz dates, with additional pacing prompts attached as dates on videos that paral