Canvas analytics and assessment data week seventeen fall 2021

The surge seen in week sixteen built in week seventeen in terms of page views on the Instructure Canvas platform. Week seventeen consisted of the last three days of classes along with the first two days of final examinations. At the time this report was written, Friday data is not complete but is projected to fall from week sixteen as an increasing number of students complete their final examinations and projects.


Although Friday numbers were down week-on-week, the week thus far has seen more page views, a proxy for platform engagement, than week sixteen. Engagement remains at the highest levels since midterm.


The strength of the surge can be seen in the first four days of week seventeen. This level of engagement has not been seen on a daily basis since week eight midterms. 


With the exception of assignments, instructor driven metrics have leveled off. Assignments continued to see growth in week 17.  Note that assignments also includes quizzes and tests.

Assessment


The outcome results table is now 8107 rows of which 6805 are scored (instructors can opt to strip out scores from rubrics resulting in ratings without scores).

Dashboards

Course learning outcomes fall 2021
General education outcomes 2021.3
Course learning outcomes assessment fall 2021 dll sis
Pentascale average time series fall 2021
Learning outcome ratings on assignments only 2021.3
Spectacular dashboards: a cautionary tale

Reports

Week one: Assessment available at sunrise on a new term
Week two: SIS disaggregation and a deep dive into mapping decisions
Week three: SIS disaggregation and another dive into mapping complexities
Technologies available to students
Week four: A focus on subaccounts and campuses
Week five: Pivot of state of origin versus gender
Week six: Dashboards can be focused
Attendance versus performance in statistics
Week seven: Outcome performance at the course level and other dashboards
Week eight: Update at midterm
Week nine: A look at score and grade distributions
Week ten: Grey goo revisited
Week eleven: Update on the numbers
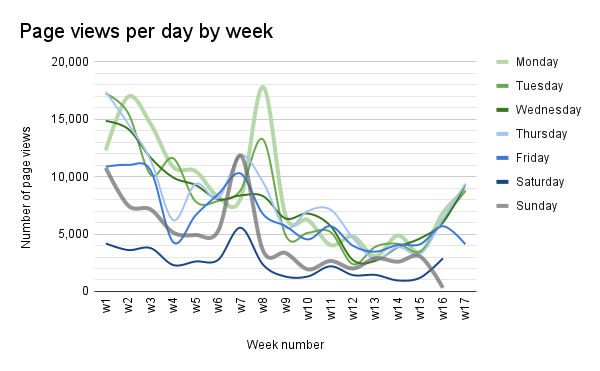
Week twelve: Page views collapse
Week thirteen: Holiday impact or disengagement?
Week fourteen: Some indications of reengagement
Week fifteen: A look at courses ranked by learning
Week sixteen: Engagement surge
Week seventeen: Numbers in the week in which classes ended

Comments

Popular posts from this blog

Plotting polar coordinates in Desmos and a vector addition demonstrator

Setting up a boxplot chart in Google Sheets with multiple boxplots on a single chart

Traditional food dishes of Micronesia