Assessing learning in physical science
A proposed outline for SC 130 Physical Science includes the following three course level student learning outcomes:
The first learning outcome requires that the students be able to explore physical science systems using scientific methodologies. For SC 130 Physical Science this exploration would be framed by the theme of mathematical models that underlie physical science systems. This, in turn, serves the general education program learning outcome, "3.5 Perform experiments that use scientific methods as part of the inquiry process."
Laboratory nine involved the measuring of the speed of sound by timing the echoes off of claps of a pair of boards. Of twenty-six students in the course, twenty-two turned in laboratory nine. An analysis of the laboratories provides an assessment of the ability of the students to explore a physical science system using scientific methodologies.

100% of the laboratory reports submitted included a properly formatted data table, all but one laboratory report had a correctly done xy scattergraph. The most common error students make is to use a line chart in lieu of an xy scattergraph. 17 students (77% of the 22) added a linear trend line to their graph. Four students did not add any trend line to their xy scattergraph. 16 students analyzed the nature of the relationship with all but two noting that the relationship was probably linear. Two students expressed the opinion that the relationship was non-linear. Only fifteen students were then able to correctly quote the slope in their analysis section of their laboratory report. The slope was the speed of sound, and measuring that speed was the intent of the laboratory.
The closing section of the laboratory report format in SC 130 Physical Science is a discussion of the results. Only five students had a discussion that showed clear comprehension of the intent of the laboratory. The remaining students clearly did not understand that the slope was indeed the speed of sound and that measuring this value had been the point of the laboratory.
Thus students are capable at performing the mechanics of analyzing data - making tables, graphs, adding trend lines, and incorporating these into a word processing document. The students are, in general, unable to understand what their data means. At higher levels of Bloom's taxonomy the students are less capable - analysis, synthesis, and evaluation of their results.
The second learning outcome, "Generate mathematical models for physical science systems and use appropriate mathematical techniques and concepts to obtain quantitative solutions to problems in physical science," serves, in part, the general education program learning outcome, "3.2 Present and interpret numeric information in graphic forms."This, in turn, serves an institutional learning outcome for quantitative reasoning: "Students will be able to reason and solve quantitative problems from a wide array of authentic contexts and everyday life situations; comprehend and can create sophisticated arguments supported by quantitative evidence and can clearly communicate those arguments in a variety of formats."
Underneath the focus on physical systems, SC 130 Physical Science is built on a foundation of connecting physical systems to their mathematical models and communicating the results in writing. Laboratory exercises lead to the writing of a full laboratory report that is marked for content, syntax, grammar, vocabulary, organization, and cohesion.
The majority of the laboratories investigate systems that involve a linear mathematical relationship. Reports include xy scatter graphs, best fit linear trend lines, slope, and y-intercept analysis.
Twenty-six students in physical science fall 2014 were given eleven questions which focused on interpreting and generating numeric information in graphic forms. Specifically, the pre-assessment focused on xy scatter graphs and linear trend lines. The pre-assessment was done on the first day of class and included 26 of the students in the course. Performance on the pre-assessment was weak at best.
SC 130 Physical Science is designed to address these mathematical weaknesses. The course has as one of its intents the placing of the mathematics into less abstract contexts. The concept is that the laboratory systems and data might provide cognitive hooks on which the students can attach a stronger comprehension of linear mathematical models.
Laboratories one, two, three, four, five, seven, nine, eleven, twelve, and fourteen involve linear relationships between the variables being studied. Non-linear relationships are also generated by some activities in the course. Although the students use spreadsheets to obtain the best fit trend line, the students were still working with concrete systems with variables that are related linearly.
Performance improved significantly on the same questions when those questions were included in the final examination.

The chart above depicts the number of students answering a question correctly on the pre-assessment on the left end of the line, the number of students answering a question correctly on the post-assessment on the right end of the line. Improvement is seen on all questions except the one question where students are asked to calculate an independent x value when given a dependent y value. This operation requires solving the equation for the independent x variable. Student performance on this question was actually relatively high on the pre-assessment and did not improve significantly on the post-assessment.

Improvement in student performance can also be seen when the distribution of the student scores is examined. Marking each question as being worth one point, the high score on the pre-assessment was ten of eleven correct and this was an outlier at over three inter-quartile ranges above the third quartile. The median correct on the pre-assessment was two. On the post-assessment the median correct was eight and a perfect score was not an outlier. On the pre-assessment there were students who scored zero correct, no student scored an absolute zero on the post-assessment. That said, two students answered only three questions correctly on the post-assessment.
The third learning outcome serves, in part, the general education program learning outcome, "1.1 Write a clear, well-organized paper using documentation and quantitative tools when appropriate."
When I took over and redesigned SC 130 Physical Science in 2007 I had two focuses. The dual focuses were to put mathematics and writing into the core of the course. By building laboratories around mathematical models and having students write up the results of those laboratories in reports marked for content, grammar, vocabulary, organization, and cohesion, both goals were simultaneously achieved.
The redesigned course is intended to include support for general education program student learning outcome 1.1. The course also now serves the second institutional learning outcome, "Effective written communication: development and expression of ideas in writing through work in many genres and styles, utilizing different writing technologies, and mixing texts, data, and images through iterative experiences across the curriculum." The laboratory reports include tables and charts prepared in a spreadsheet and then inserted into the final report using word processing software. Effective written communication also requires command and control of grammar, vocabulary, organization, and cohesion. This article reports on these writing metrics in a non-language and literature course.
The course includes 15 laboratories. Odd numbered laboratories include a full write-up with grammar, vocabulary, organization, and cohesion being marked. The exception is that laboratory 15 is not turned-in, so laboratory 14 is done as a full write-up laboratory. In the regular term eight full laboratory reports are done during 16 weeks.
Grammar (G), vocabulary (V), organization (O), and cohesion (C) are scored using a rubric with a total possible of 20 points. Each of the four metrics are scored on a 0 to 5 point scale. The rubric was reported in an earlier blog article. Laboratories one (1 in the chart) and nine (2 in the chart) were analyzed.


The chart provides anecdotal evidence that the sheer number of holidays and their concentration in an eight day period, is detrimental to learning and may ultimately affect course completion rates.
In a separate note, a proposal to put only course level student learning outcomes on outlines at the college is an excellent concept. The reduction from the number of specific student learning outcomes is exactly what allows for an analysis such as the one above - an analysis that I believe generates real and actionable information on learning. Course outlines should move to including only course level student learning outcomes, permitting instructors to provide more thoughtful analysis of those outcomes.
- Explore physical science systems using scientific methodologies
- Generate mathematical models for physical science systems and use appropriate mathematical techniques and concepts to obtain quantitative solutions to problems in physical science.
- Demonstrate basic communication skills by working in groups on laboratory experiments and by writing up the result of experiments, including thoughtful discussion and interpretation of data, in a formal format using spreadsheet and word processing software.
The first learning outcome requires that the students be able to explore physical science systems using scientific methodologies. For SC 130 Physical Science this exploration would be framed by the theme of mathematical models that underlie physical science systems. This, in turn, serves the general education program learning outcome, "3.5 Perform experiments that use scientific methods as part of the inquiry process."
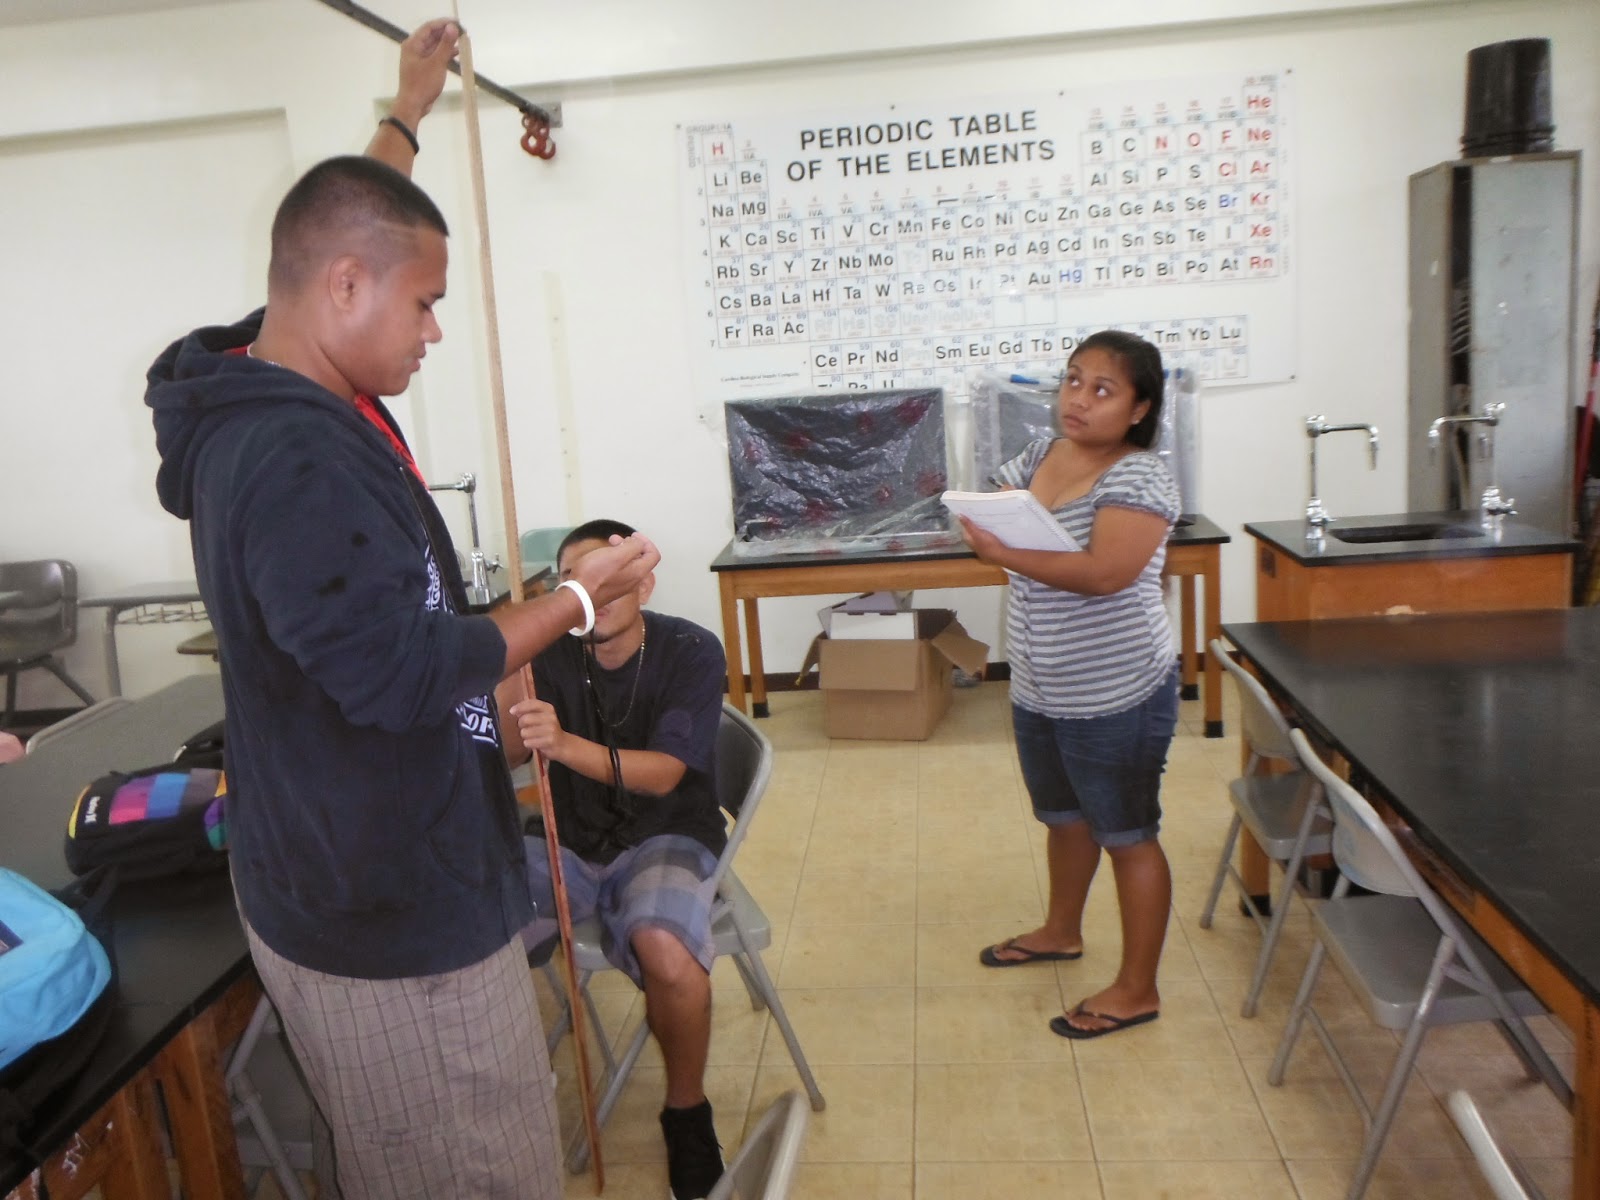 |
| Paulino times and drops, Alex holds meter sticks, Mailynda records data in laboratory three. |
Laboratory nine involved the measuring of the speed of sound by timing the echoes off of claps of a pair of boards. Of twenty-six students in the course, twenty-two turned in laboratory nine. An analysis of the laboratories provides an assessment of the ability of the students to explore a physical science system using scientific methodologies.
The students were accustomed to the basic procedure of making a table, an xy scattergraph, adding a linear trend line, and using that result to analyze and discuss the laboratory results. Student success rates on different portions of this process are shown in the chart.
The closing section of the laboratory report format in SC 130 Physical Science is a discussion of the results. Only five students had a discussion that showed clear comprehension of the intent of the laboratory. The remaining students clearly did not understand that the slope was indeed the speed of sound and that measuring this value had been the point of the laboratory.
Thus students are capable at performing the mechanics of analyzing data - making tables, graphs, adding trend lines, and incorporating these into a word processing document. The students are, in general, unable to understand what their data means. At higher levels of Bloom's taxonomy the students are less capable - analysis, synthesis, and evaluation of their results.
The second learning outcome, "Generate mathematical models for physical science systems and use appropriate mathematical techniques and concepts to obtain quantitative solutions to problems in physical science," serves, in part, the general education program learning outcome, "3.2 Present and interpret numeric information in graphic forms."This, in turn, serves an institutional learning outcome for quantitative reasoning: "Students will be able to reason and solve quantitative problems from a wide array of authentic contexts and everyday life situations; comprehend and can create sophisticated arguments supported by quantitative evidence and can clearly communicate those arguments in a variety of formats."
Underneath the focus on physical systems, SC 130 Physical Science is built on a foundation of connecting physical systems to their mathematical models and communicating the results in writing. Laboratory exercises lead to the writing of a full laboratory report that is marked for content, syntax, grammar, vocabulary, organization, and cohesion.
The majority of the laboratories investigate systems that involve a linear mathematical relationship. Reports include xy scatter graphs, best fit linear trend lines, slope, and y-intercept analysis.
Twenty-six students in physical science fall 2014 were given eleven questions which focused on interpreting and generating numeric information in graphic forms. Specifically, the pre-assessment focused on xy scatter graphs and linear trend lines. The pre-assessment was done on the first day of class and included 26 of the students in the course. Performance on the pre-assessment was weak at best.
SC 130 Physical Science is designed to address these mathematical weaknesses. The course has as one of its intents the placing of the mathematics into less abstract contexts. The concept is that the laboratory systems and data might provide cognitive hooks on which the students can attach a stronger comprehension of linear mathematical models.
Laboratories one, two, three, four, five, seven, nine, eleven, twelve, and fourteen involve linear relationships between the variables being studied. Non-linear relationships are also generated by some activities in the course. Although the students use spreadsheets to obtain the best fit trend line, the students were still working with concrete systems with variables that are related linearly.
Performance improved significantly on the same questions when those questions were included in the final examination.
The chart above depicts the number of students answering a question correctly on the pre-assessment on the left end of the line, the number of students answering a question correctly on the post-assessment on the right end of the line. Improvement is seen on all questions except the one question where students are asked to calculate an independent x value when given a dependent y value. This operation requires solving the equation for the independent x variable. Student performance on this question was actually relatively high on the pre-assessment and did not improve significantly on the post-assessment.
Improvement in student performance can also be seen when the distribution of the student scores is examined. Marking each question as being worth one point, the high score on the pre-assessment was ten of eleven correct and this was an outlier at over three inter-quartile ranges above the third quartile. The median correct on the pre-assessment was two. On the post-assessment the median correct was eight and a perfect score was not an outlier. On the pre-assessment there were students who scored zero correct, no student scored an absolute zero on the post-assessment. That said, two students answered only three questions correctly on the post-assessment.
The third learning outcome serves, in part, the general education program learning outcome, "1.1 Write a clear, well-organized paper using documentation and quantitative tools when appropriate."
When I took over and redesigned SC 130 Physical Science in 2007 I had two focuses. The dual focuses were to put mathematics and writing into the core of the course. By building laboratories around mathematical models and having students write up the results of those laboratories in reports marked for content, grammar, vocabulary, organization, and cohesion, both goals were simultaneously achieved.
The redesigned course is intended to include support for general education program student learning outcome 1.1. The course also now serves the second institutional learning outcome, "Effective written communication: development and expression of ideas in writing through work in many genres and styles, utilizing different writing technologies, and mixing texts, data, and images through iterative experiences across the curriculum." The laboratory reports include tables and charts prepared in a spreadsheet and then inserted into the final report using word processing software. Effective written communication also requires command and control of grammar, vocabulary, organization, and cohesion. This article reports on these writing metrics in a non-language and literature course.
The course includes 15 laboratories. Odd numbered laboratories include a full write-up with grammar, vocabulary, organization, and cohesion being marked. The exception is that laboratory 15 is not turned-in, so laboratory 14 is done as a full write-up laboratory. In the regular term eight full laboratory reports are done during 16 weeks.
Grammar (G), vocabulary (V), organization (O), and cohesion (C) are scored using a rubric with a total possible of 20 points. Each of the four metrics are scored on a 0 to 5 point scale. The rubric was reported in an earlier blog article. Laboratories one (1 in the chart) and nine (2 in the chart) were analyzed.
Performance on the metrics was not weak at term start on laboratory one. The rubric is based on an adaptation of the one used by the college to mark entrance test essays. With exceptions, most of the students fall 2014 had an ability to write at the start of the course. There is no writing pre-requisite for the course and the above data would argue that there does not need to be a writing pre-requisite to the course. The students most commonly make errors tense (tense shifts), singular/plural verb agreement, and spelling errors that often relate to sounds not present (or used differently) in their L1 languages (p and b swaps, t and d).
There was no significant improvement on the metrics from lab one to lab nine in part because the students wrote fairly well on laboratory one.
The median score lifted from 17 to 20, a difference that was not significant. There is only the suggestion that students may have focused more on their writing in laboratory nine than in laboratory one.
During the analysis and assessment of the course I noted that submission rates fell after a triple holiday in November (November 3, 7 and 11). The string of three day weekends, three and four day weeks, appears to derail student effort as measured by laboratory submission rates. In the chart below, these holidays hit after laboratory nine. Hence the use of laboratory nine in an analysis earlier in this assessment article.
The chart provides anecdotal evidence that the sheer number of holidays and their concentration in an eight day period, is detrimental to learning and may ultimately affect course completion rates.
In a separate note, a proposal to put only course level student learning outcomes on outlines at the college is an excellent concept. The reduction from the number of specific student learning outcomes is exactly what allows for an analysis such as the one above - an analysis that I believe generates real and actionable information on learning. Course outlines should move to including only course level student learning outcomes, permitting instructors to provide more thoughtful analysis of those outcomes.


Comments
Post a Comment