Numeric information in graphic forms skills pre-assessment
Underneath the focus on physical systems, SC 130 Physical Science is built on a foundation of connecting physical systems to their mathematical models and communicating the results in writing. Laboratory exercises lead to the writing of a full laboratory report that is marked for content, syntax, grammar, vocabulary, organization, and cohesion.
The majority of the laboratories investigate systems that involve a linear mathematical relationship. Reports include xy scatter graphs, best fit linear trend lines, slope, and y-intercept analysis. The course outline includes the learning outcome, "Students will generate mathematical models for physical science systems." This serves a general education program learning outcome, "Students will be able to present and interpret numeric information in graphic forms," which in turn serves an institutional learning outcome for quantitative reasoning: "Students will be able to reason and solve quantitative problems from a wide array of authentic contexts and everyday life situations; comprehend and can create sophisticated arguments supported by quantitative evidence and can clearly communicate those arguments in a variety of formats."
Twenty-four of the twenty-seven students enrolled in physical science fall 2014 were present the first day. These 24 students completed a pre-assessment consisting of eleven questions which focused on interpreting and generating numeric information in graphic forms.
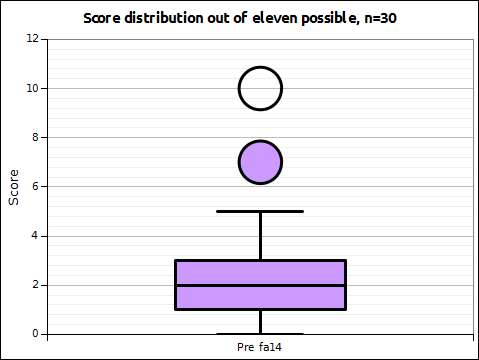
In general student performance was generally abysmal. The average was 2.60 questions were answered correctly with a median of two questions answered correctly. Twenty-five percent of the class could answer no more than a single question correctly. Bear in mind that many students have completed MS 100 College Algebra, at least three have completed MS 150 Statistics, and two were known to have completed MS 101 Algebra and Trigonometry. One of the MS 101 completers finished MS 101 with a grade of "A."

The question most commonly answered correctly was the plotting of paired xy data presented in tabular format. Nineteen of 24 students successfully plotted the points on a provided graph.
SC 130 Physical Science is designed to address these mathematical weaknesses. The course has as one of its intents the placing of the mathematics into less abstract contexts. The concept is that the laboratory systems and data might provide cognitive hooks on which the students can attach a stronger comprehension of linear mathematical models.
Laboratories one, two, three, four, five, seven, nine, eleven, twelve, and fourteen involve linear relationships between the variables being studied. Non-linear relationships are also generated by some activities in the course. Although the students use spreadsheets to obtain the best fit trend line, the students are still working with concrete systems with variables that are related linearly.
Although fall term 2014 is only just beginning, historically performance improves markedly from the pre-assessment to the post-assessment. Whether students then retain this knowledge through to graduation, or beyond, remains an open question.
The majority of the laboratories investigate systems that involve a linear mathematical relationship. Reports include xy scatter graphs, best fit linear trend lines, slope, and y-intercept analysis. The course outline includes the learning outcome, "Students will generate mathematical models for physical science systems." This serves a general education program learning outcome, "Students will be able to present and interpret numeric information in graphic forms," which in turn serves an institutional learning outcome for quantitative reasoning: "Students will be able to reason and solve quantitative problems from a wide array of authentic contexts and everyday life situations; comprehend and can create sophisticated arguments supported by quantitative evidence and can clearly communicate those arguments in a variety of formats."
Twenty-four of the twenty-seven students enrolled in physical science fall 2014 were present the first day. These 24 students completed a pre-assessment consisting of eleven questions which focused on interpreting and generating numeric information in graphic forms.
In general student performance was generally abysmal. The average was 2.60 questions were answered correctly with a median of two questions answered correctly. Twenty-five percent of the class could answer no more than a single question correctly. Bear in mind that many students have completed MS 100 College Algebra, at least three have completed MS 150 Statistics, and two were known to have completed MS 101 Algebra and Trigonometry. One of the MS 101 completers finished MS 101 with a grade of "A."
The question most commonly answered correctly was the plotting of paired xy data presented in tabular format. Nineteen of 24 students successfully plotted the points on a provided graph.
SC 130 Physical Science is designed to address these mathematical weaknesses. The course has as one of its intents the placing of the mathematics into less abstract contexts. The concept is that the laboratory systems and data might provide cognitive hooks on which the students can attach a stronger comprehension of linear mathematical models.
Laboratories one, two, three, four, five, seven, nine, eleven, twelve, and fourteen involve linear relationships between the variables being studied. Non-linear relationships are also generated by some activities in the course. Although the students use spreadsheets to obtain the best fit trend line, the students are still working with concrete systems with variables that are related linearly.
Although fall term 2014 is only just beginning, historically performance improves markedly from the pre-assessment to the post-assessment. Whether students then retain this knowledge through to graduation, or beyond, remains an open question.


Comments
Post a Comment