Arc of a ball and acceleration of gravity
Exercise 031,
the mapping of the parabolic arc of a ball, was modified again this term. I
wanted more data points than the exercise traditionally generates. Last fall I hit upon the idea of keeping the arc wholly on the white board
and using an army of students with markers to capture the ball arc data
points.
I repeated this again during the spring term, although the marks were not as accurate as I might have hoped. I also did not leave enough time to explain the theoretic function, how to enter it into a third column in a spread sheet, and then graph the actual data and the theoretic curve on the same chart in a spreadsheet. Spring term I had 34 students, checking their RipStik accelertion homework took longer than usual. Although the homework check uses time, it also provides a valuable opportunity to see what each and every student is able to do and not do.
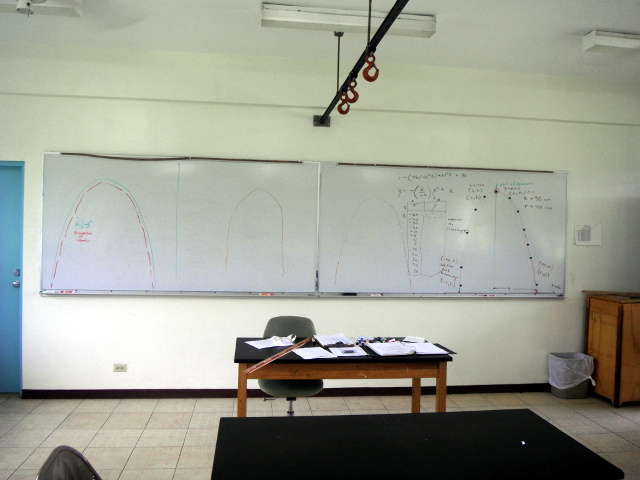
Fall 2011 the homework check took time and I again did not have the time I would have liked to introduce the theoretic function and how to enter the function correctly into a spreadsheet. I did, however, develop a new way to get the arc up on the board. This time I used four balls and I sectored the board into four sections.
 I had groups of two students per quadrant map out the arc of a ball using magnetic doughnuts. I used the space balls which are large and easy to toss.
 After the students had marked the path with the magnets, the students connected the dots using white board markers. This produced four fairly parabolic paths on the board. I made measurements of one and then introduced the function.
 The homework was only to graph the theoretic function, no measurements were made other than r and k as seen above.
Laboratory 032 involves timing the fall of a ball to determine the acceleration of gravity g. The students drop a small superball from heights of 100 to 300 centimeters inside the classroom.
I began by making measurements in a demonstration at the front of the class, averaging a series of drops from various heights and then sketching the result.
 This proved beneficial as it led to most of the groups using the average drop time for repeated measurements, which reduced the error for many groups.
 A student, possibly Donnalynn, prepares to drop a superball.
 Trasleen steadies the meter stick just after Katsandra has released the small green superball. Agnes records data.
 Connie calculates the average for multiple drops from a specific height.
 MacArthur looks over some of his data.
 Gorang makes calculations while MacArthur observes: laboratories get students doing and discussing science. Even simple laboratories.
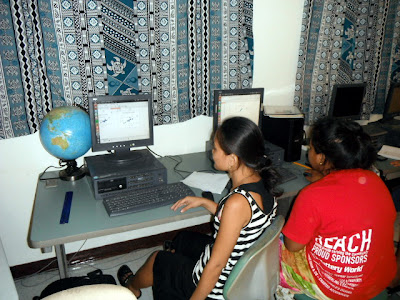 The second half of the laboratory is held up in the computer laboratory where I assist students in making the two graphs. Charleen is working on her second graph in the image above. My own data at 8:00 was within 1% of the actual value of g, the smallest error I can recall.
I repeated this again during the spring term, although the marks were not as accurate as I might have hoped. I also did not leave enough time to explain the theoretic function, how to enter it into a third column in a spread sheet, and then graph the actual data and the theoretic curve on the same chart in a spreadsheet. Spring term I had 34 students, checking their RipStik accelertion homework took longer than usual. Although the homework check uses time, it also provides a valuable opportunity to see what each and every student is able to do and not do.
Fall 2011 the homework check took time and I again did not have the time I would have liked to introduce the theoretic function and how to enter the function correctly into a spreadsheet. I did, however, develop a new way to get the arc up on the board. This time I used four balls and I sectored the board into four sections.


Laboratory 032 involves timing the fall of a ball to determine the acceleration of gravity g. The students drop a small superball from heights of 100 to 300 centimeters inside the classroom.
I began by making measurements in a demonstration at the front of the class, averaging a series of drops from various heights and then sketching the result.


Comments
Post a Comment