Arc of a ball
Exercise 031, the mapping of the parabolic arc of a ball, was modified this term. I wanted more data points than the exercise traditionally generates. Last fall I hit upon the idea of keeping the arc wholly on the white board and using an army of students with markers to capture the ball arc data points.
I repeated this again this term, although the marks were not as accurate as I might have hoped. I also did not leave enough time to explain the theoretic function, how to enter it into a third column in a spread sheet, and then graph the actual data and the theoretic curve on the same chart in a spreadsheet. With 34 students, checking homework took longer. Although the homework check uses time, it also provides a valuable opportunity to see what each and every student is able to do and not do.
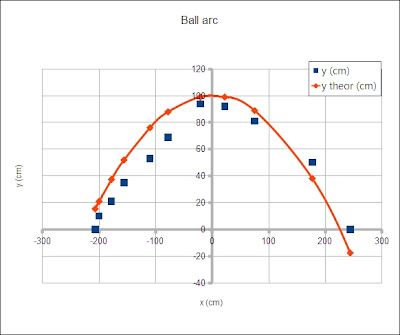 The third column of the table is to include the theoretic values based on the equation in the book.The homework was to generate the graph and describe whether the equation appears to well match the actual path of the ball in the air. Is the arc actually described by a quadratic equation and thus parabolic? This term the data leaved much to be desired - the ball wandered through the air.
| x (cm) | y (cm) | y theor (cm) |
| -207 | 0 | 15.36 |
| -200 | 10 | 20.99 |
| -178 | 21 | 37.41 |
| -156 | 35 | 51.93 |
| -110 | 53 | 76.1 |
| -78 | 69 | 87.98 |
| -21 | 94 | 99.13 |
| 22 | 92 | 99.04 |
| 75 | 81 | 88.89 |
| 177 | 50 | 38.12 |
| 244 | 0 | -17.6 |
I repeated this again this term, although the marks were not as accurate as I might have hoped. I also did not leave enough time to explain the theoretic function, how to enter it into a third column in a spread sheet, and then graph the actual data and the theoretic curve on the same chart in a spreadsheet. With 34 students, checking homework took longer. Although the homework check uses time, it also provides a valuable opportunity to see what each and every student is able to do and not do.


Comments
Post a Comment