Acceleration of gravity
Laboratory three measures the acceleration of gravity. This term I began with the results of 021 and 030 sketched on the board and asked whether a falling ball falls at a constant velocity or an ever increasing velocity. The students were split in their opinions, with many choosing to be non-committal. I noted that our experience with linear constant velocity and ever increasing velocity meant that a time versus distance graph would distinguish these two instances. If there was an increasing velocity, then underneath that increase would be an acceleration that could be called the acceleration of gravity.

I then covered the specific procedure.


Later in the computer laboratory I would find that for one lab team, plotting all of their data individually would reduce their error. This was an approach I had not taken with the data before.


Friday I opened with a quick overview of the week and the nature of the parabolas, and then had the students sketch ball arcs on the board.

Although the balls were distributed to both genders, as is too often the case only the men wound up at the board. I used this to cover the issue of equipment and gender in science classes and the interplay with cultural factors out here. The class continues to serve as a pre-teacher prep course among its many other roles.

The arcs. The question left to the students: what is the equation. Many used Desmos tables and a quadratic regression to find the equation.

I then covered the specific procedure.


Ray drops and times, Erson holds the meter stick

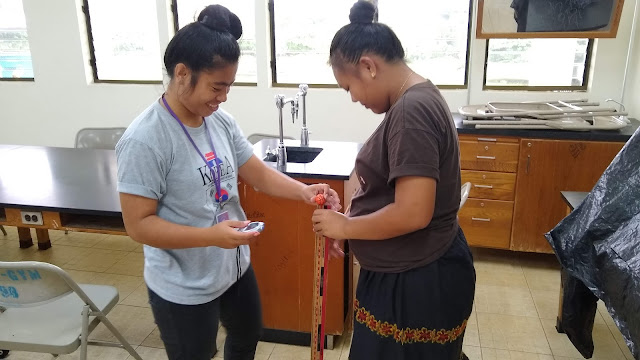
Mayson drops and times, Kimmy holds the meter stick

Susan and Mayboleen

James and Jerick
Friday I opened with a quick overview of the week and the nature of the parabolas, and then had the students sketch ball arcs on the board.

Although the balls were distributed to both genders, as is too often the case only the men wound up at the board. I used this to cover the issue of equipment and gender in science classes and the interplay with cultural factors out here. The class continues to serve as a pre-teacher prep course among its many other roles.

The arcs. The question left to the students: what is the equation. Many used Desmos tables and a quadratic regression to find the equation.


Comments
Post a Comment