Linear motion
As per notes made January 2018, I shifted back to using meters for the RipStik linear motion exercise to simplify Desmos data entry. Prior to class I measured out a 30 meter run with timing marks every three meters. I also set up a Desmos table with the distance data, leaving the time cells blank.

This pre-class work was even more necessary fall 2018 as the class periods are now 50 minutes long, as opposed to 55 minutes as they were last term. I had to go over the Friday quiz and then move out to the sidewalk to gather data. I prefaced the sidewalk work with a speed calculation from Friday's long run: 15015 meters ÷ 6000 seconds = 2.50 meters per second. I do not know that this helped as an introduction to speed.

The run ended at 15.78 seconds and 30 meters. As seen on the graph, the slope displays well on a "square" graph, something that was not the case when the distance was in centimeters.

Wednesday I demonstrated Desmos on the television monitor at the back of A101 using my laptop computer. The students, however, did not run into the issue of the points falling on the y-axis as occurred with the use of centimeters in prior terms. In the past, the distances were in multiple hundreds of centimeters, which forced the use of a non-square scale, the y-axis had to be manually rescaled to handle the hundreds of centimeters. Lost in Math, however, reminded me that values near one are beautiful - which is the exact opposite of the thesis of the book (that not everything should tend to be near one). Slopes closer to unity are displayed correctly by Desmos without a lot of adjustment of the scale, and the adjustments that are necessary are square. Thus this went quicker than prior terms. This now leaves Wednesday undeveloped again. I tried riffing off the the Yap Micro games this summer, tackling the average speed of runners at various distances, which built on my quoting my running speed on Monday. This was non-interactive and not terribly coherent. This needs work and redesign to be a more active exploration of velocity.

In Thursday's laboratory I was the pitcher, no catcher was assigned. The morning class was even in number, so I had all pairs gathering data. The slow ball was done on 0, 3, 6, 9, 12, and 15 meter markings. The medium speed ball was measured across markings at 0, 5, 10, and 15 meters. The fast ball was done by some students at 10 and 20 meters, others were still timing every five meters. For the fast ball students were volunteering in to see if they could get a ball down the middle faster.

The rainy day was again no problem given the covered walkways. They are starting to leak in places.


The above data derived from the 11:00 section, the red solid line was the RipStik velocity from Monday.

This pre-class work was even more necessary fall 2018 as the class periods are now 50 minutes long, as opposed to 55 minutes as they were last term. I had to go over the Friday quiz and then move out to the sidewalk to gather data. I prefaced the sidewalk work with a speed calculation from Friday's long run: 15015 meters ÷ 6000 seconds = 2.50 meters per second. I do not know that this helped as an introduction to speed.

The run ended at 15.78 seconds and 30 meters. As seen on the graph, the slope displays well on a "square" graph, something that was not the case when the distance was in centimeters.
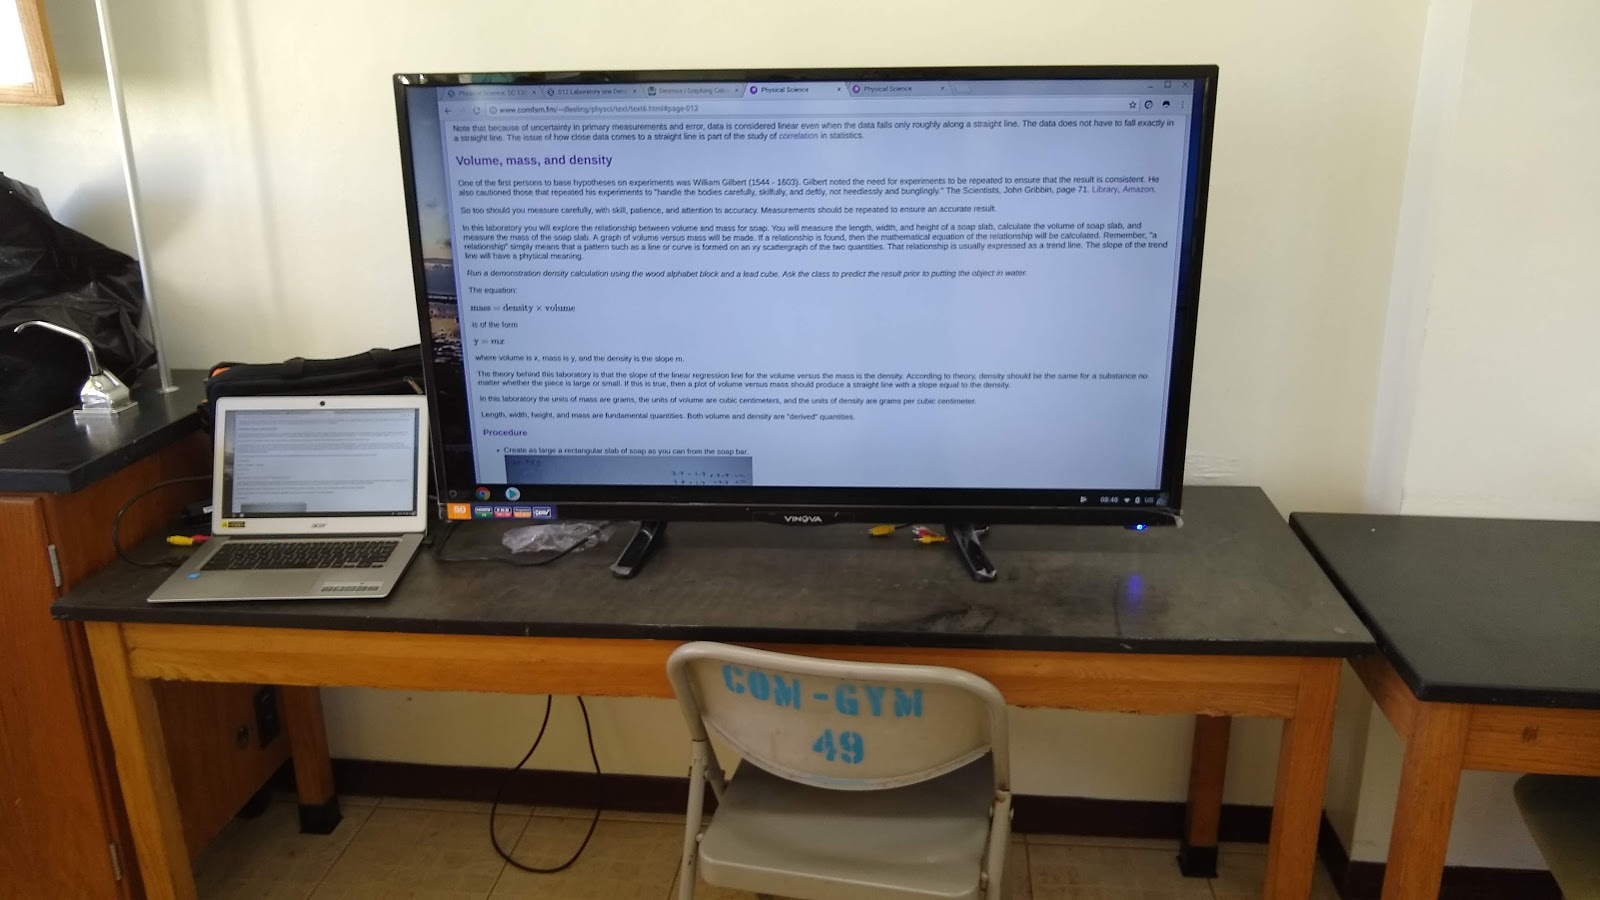
Wednesday I demonstrated Desmos on the television monitor at the back of A101 using my laptop computer. The students, however, did not run into the issue of the points falling on the y-axis as occurred with the use of centimeters in prior terms. In the past, the distances were in multiple hundreds of centimeters, which forced the use of a non-square scale, the y-axis had to be manually rescaled to handle the hundreds of centimeters. Lost in Math, however, reminded me that values near one are beautiful - which is the exact opposite of the thesis of the book (that not everything should tend to be near one). Slopes closer to unity are displayed correctly by Desmos without a lot of adjustment of the scale, and the adjustments that are necessary are square. Thus this went quicker than prior terms. This now leaves Wednesday undeveloped again. I tried riffing off the the Yap Micro games this summer, tackling the average speed of runners at various distances, which built on my quoting my running speed on Monday. This was non-interactive and not terribly coherent. This needs work and redesign to be a more active exploration of velocity.

In Thursday's laboratory I was the pitcher, no catcher was assigned. The morning class was even in number, so I had all pairs gathering data. The slow ball was done on 0, 3, 6, 9, 12, and 15 meter markings. The medium speed ball was measured across markings at 0, 5, 10, and 15 meters. The fast ball was done by some students at 10 and 20 meters, others were still timing every five meters. For the fast ball students were volunteering in to see if they could get a ball down the middle faster.

The rainy day was again no problem given the covered walkways. They are starting to leak in places.

Rosalyn and Stacey recording data after a fast ball roll
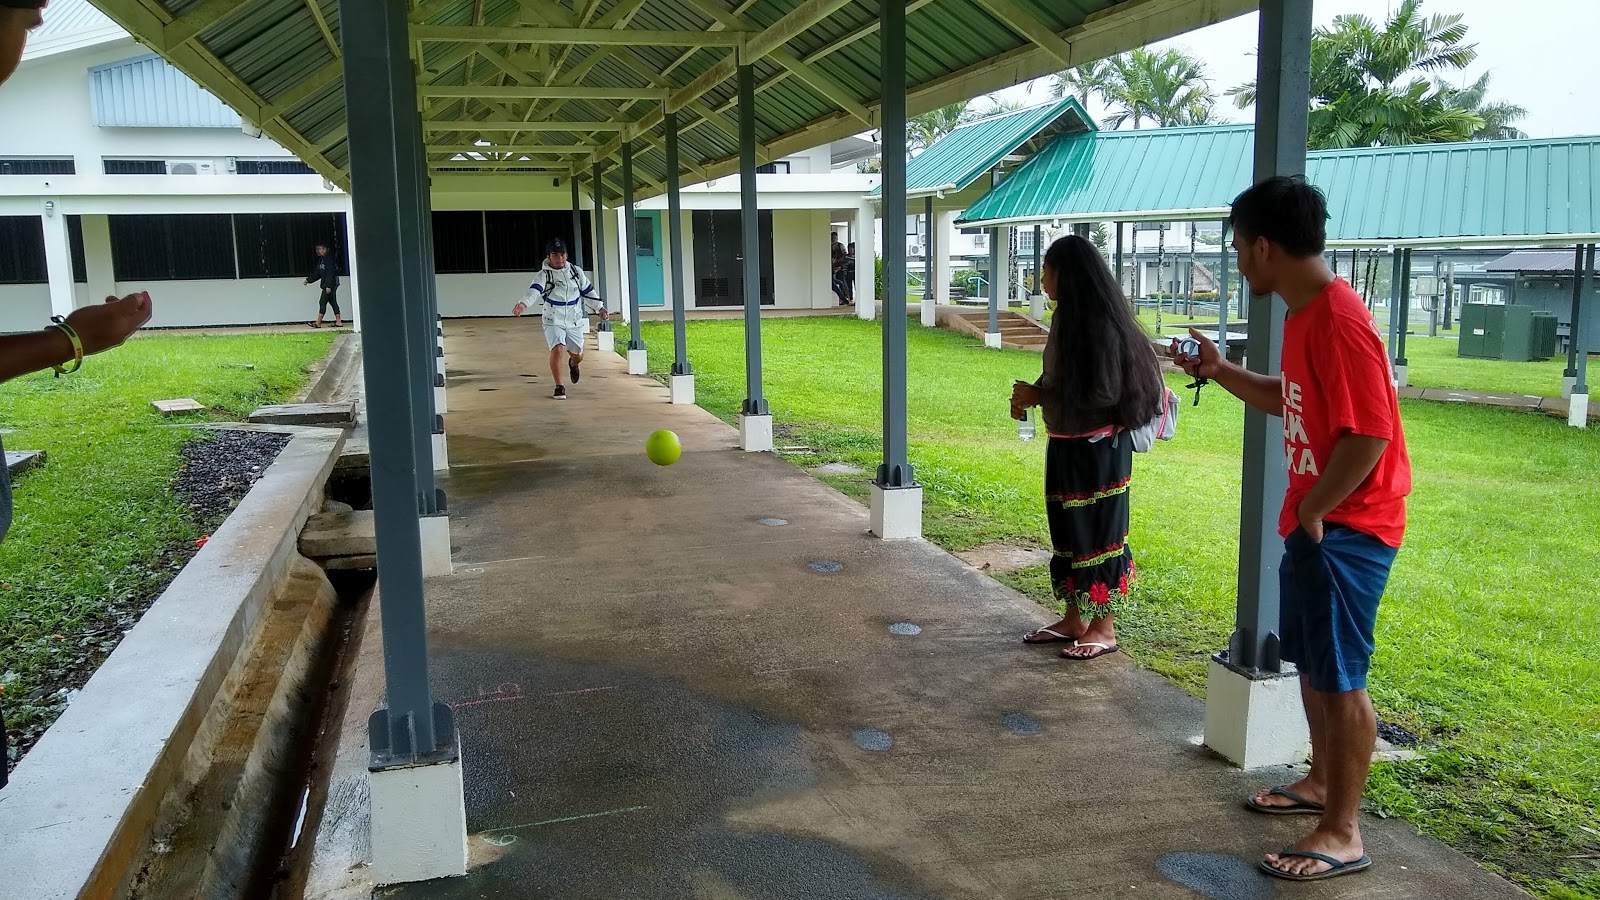
Luke takes a shot at getting a fast ball down the sidewalk

The above data derived from the 11:00 section, the red solid line was the RipStik velocity from Monday.


Comments
Post a Comment