Linear motion
After going over the first quiz on density, linear motion opened with a 3000 cm RipStik run. Although I have remained with centimeters and seconds for consistency through the first four weeks of the course, Desmos would be easier to set up this second Monday if I used meters. In centimeters the y axis runs out to 3000 while the x axis has a maximum value of around 12 seconds. The students obtain a vertical line on their display as a first result.

Seconds versus meters would be a more functional option. I suspect shifting to meters would add a somewhat hidden layer of complexity to the face digits issue of laboratory two, and would push laboratory three towards also using meters.


Although I again had a look at instantaneous velocity and the implied acceleration, I am less convinced that these values are as real as they appear. When converted to timing errors, the difference from a constant speed is always less than a tenth of a second. These are well inside reaction time for a 58 year old professor on a RipStik timing with a hand held chronograph.

On Wednesday I ran a demonstration on graphing the data in Desmos, with a particular focus on adjusting the domain and range of the graph axes. Then I ran some example velocity calculations, attempting to show the difference between the average velocity and an instantaneous velocity.

Thursday we rolled the ball at various speeds. The slow ball was rolled 800 cm timed every 100 cm. At 8:00 the medium speed ball was rolled 1000 cm timed every 200 cm. In the 11:00 section the medium speed ball was shifted to a 1500 cm run timed every 300 cm. The fast run was done to 2000 cm timed every 500 cm using blue chalk marks.

Rain throughout the morning made the sidewalk wet out at 2000 cm.
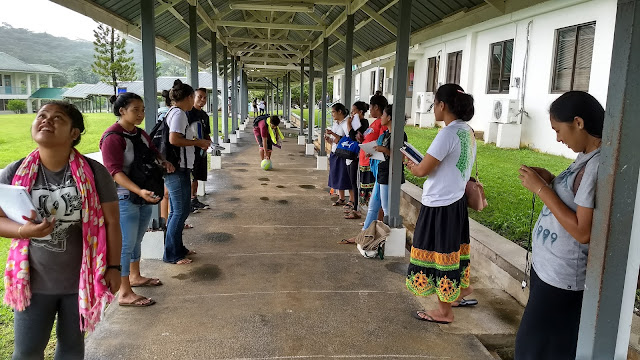
Wind associated with rain had the morning section running the medium speed ball from east to west across the yellow chalk marks set at every 200 cm.

At 11:00 I also tried bowling from the east. With the wind, this worked well.

Linear velocity data from the 8:00 section in Desmos. Friday I opted to have the class walk to the LRC and back, having one student roll the surveyor's wheel while I carried a stopwatch on the RipStik. I rode out and back, arriving back at the class after about two and a half minutes. The students starting arriving at the four minute mark. The distance is on the order of 12000 cm, converting minutes to seconds permits an average speed calculation. This was followed by a Friday quiz.


Comments
Post a Comment