Conservation of marble momentum: An open exploration laboratory
The use of known heights to obtain a height versus speed chart on Monday using the RipStik works well when followed up by the banana leaf marble ramp exercise on Wednesday. The marble height versus speed data fits extremely well to the data generated by the RipStik on Monday, and both match the behavior predicted by theory (covered on Wednesday).

The curves "nest" into each other extremely well.


Markings at 5 cm height above the table and at 10 cm above the table.

The groove atop a banana leave is ideal as a marble ramp. These leaves, however, did not perform as well as uhten Ruhk leaves - the curvature inside the midrib was too high. Curvature varies by variety.
To better connect the kinetic energy work of Wednesday to the momentum work of Thursday, I opted to show that the first derivative of d = ½at² is v = at provided the acceleration is constant. I then showed that the first derivative of KE = ½mv² is momentum p = mv provided mass does not vary with velocity (setting aside Einsteinian physics here!). Thus if energy is conserved, momentum is also conserved.


The students tended to remain "bound" to the questions asked this term, and did not explore beyond that which the questions asked. Perhaps the questions are too prescriptive? Provide too much structure?


Observing the groups engaged in conversations about the system were encouraging: the students were engaging in the process of science and discovery.


At 8:00 I had the pairs pair up to form groups of four to prepare for class presentations of results. This step was important this term: in each class only one or two groups came up with a table and graph.


The student's tended to stick to the questions as if they were a script, answering them one by one. Not an optimal result, but less structure has led to groups feeling lost. Open exploration needs some structure.


Board shots.


The curves "nest" into each other extremely well.

The green line on the above chart was generated by rolling a marble down a banana leaf in class from the heights shown in the table.


To better connect the kinetic energy work of Wednesday to the momentum work of Thursday, I opted to show that the first derivative of d = ½at² is v = at provided the acceleration is constant. I then showed that the first derivative of KE = ½mv² is momentum p = mv provided mass does not vary with velocity (setting aside Einsteinian physics here!). Thus if energy is conserved, momentum is also conserved.

Stewart observe two ejected after two are sent inbound

Juntwo observes as Francina writes down results

Rayleen observes

Maxon makes notes

Groups in quiet conversation. Gayshalaen, Ashely, Tricia
Observing the groups engaged in conversations about the system were encouraging: the students were engaging in the process of science and discovery.

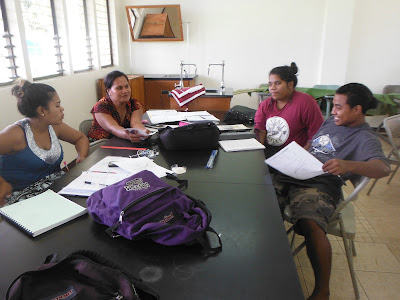
Twain, Osbert, Tania, and Ray considering a variety of issues
Francina explains her pair's results to the group of four

Tricia explains

Tricia demonstrates one of the group's findings

Gayshalane shows the group's table and chart

Francina

Tania demonstrates the results found by her and her partner

Maxon presenting

Lexus describes his group's findings

The student's tended to stick to the questions as if they were a script, answering them one by one. Not an optimal result, but less structure has led to groups feeling lost. Open exploration needs some structure.

Vandecia working on the marbles with Misko, 11:00 session, yellow marbles on a yellow ruler

Yuta works with marbles as close to identical as possible

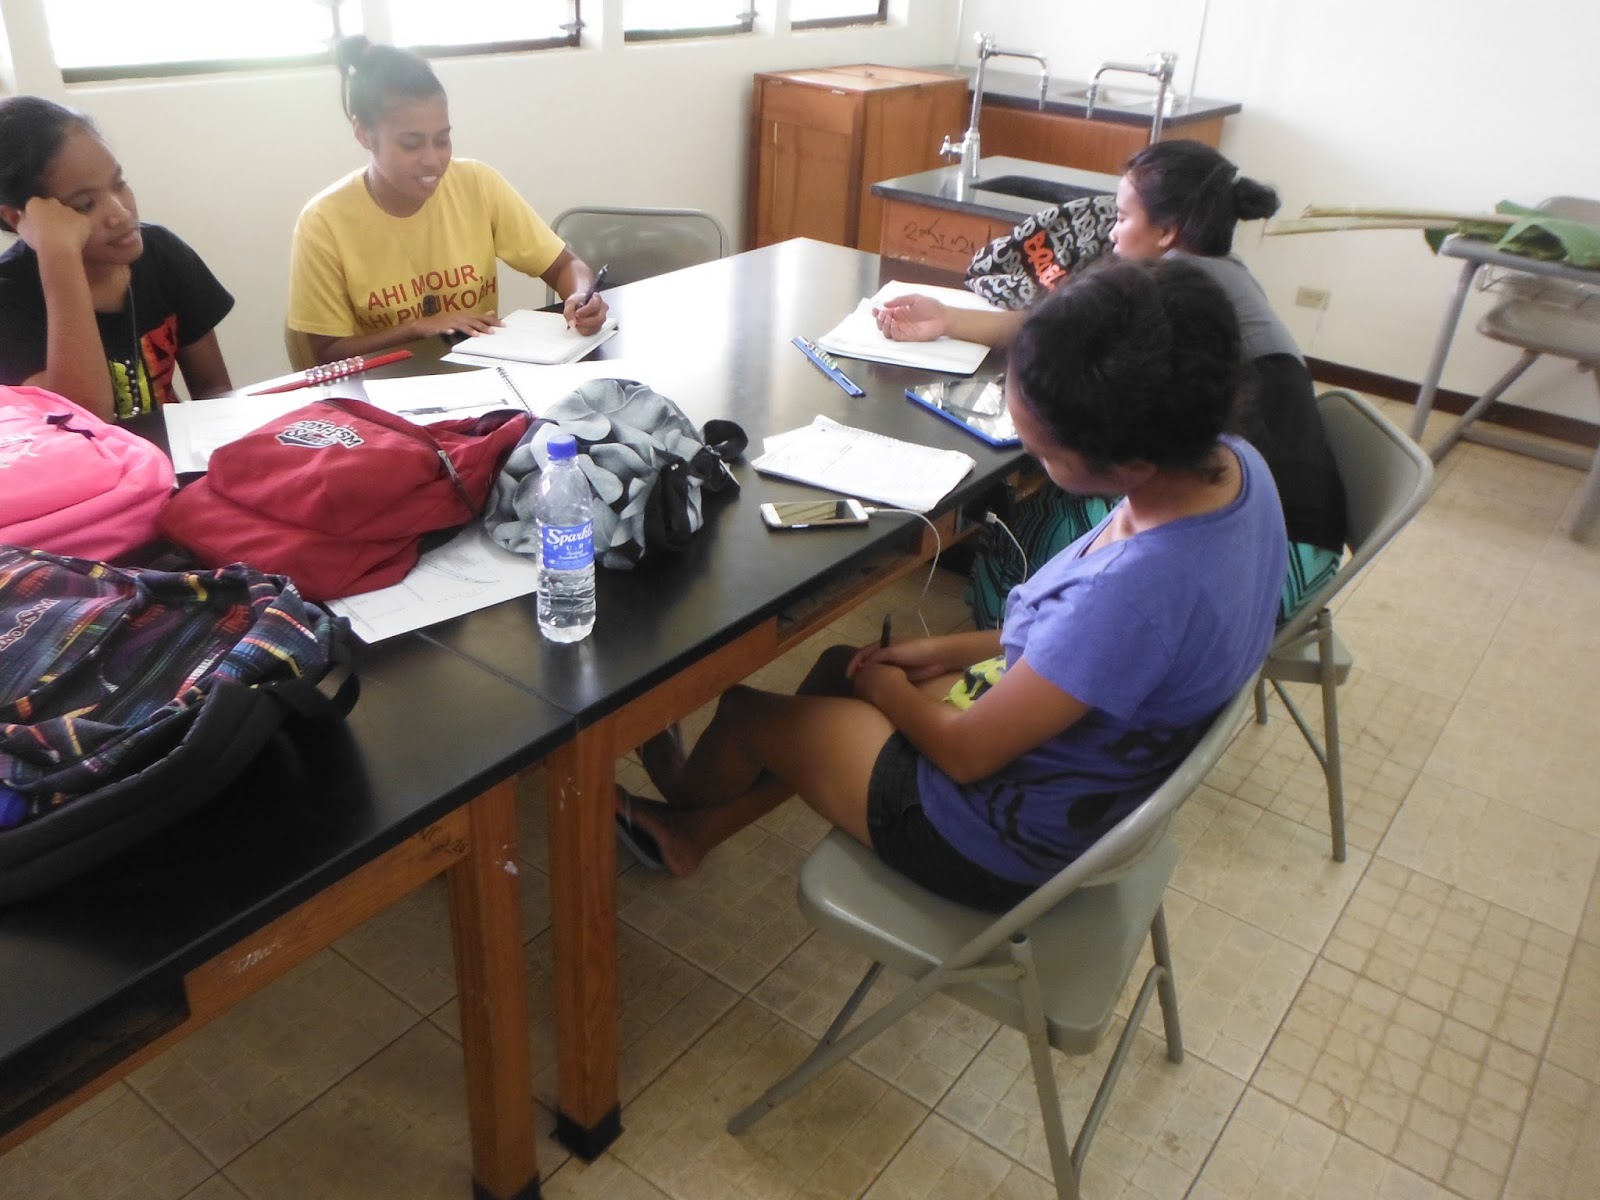
Talking over differences in findings: Madlina, Diane, Beverly-Ann, Josey
Board shots.


Comments
Post a Comment