Linear motion of a rolling ball
Last fall I shifted to using multiple chronographs in laboratory two, an exploration of the relationship between slope and speed for a moving ball. Although this shift increased the necessary equipment, the change also allowed students to work in smaller groups recording data.
I also shifted from the procedure of calling out times and having students note where the ball was at a particular time. Although this made time the independent variable, and distance the measured dependent variable, there was always an issue with the first second being longer than the other seconds. Years of trying to find way to minimize this error never yielded fruit. For some reason premarking distances and measuring time to the distance marks generates a more linear result. Probably in part by shortening the duration over which measurements occur. All curves look flat over short enough distances.
A new fiberglass tape measure reel permits measurements of up to thirty meters if necessary this term.
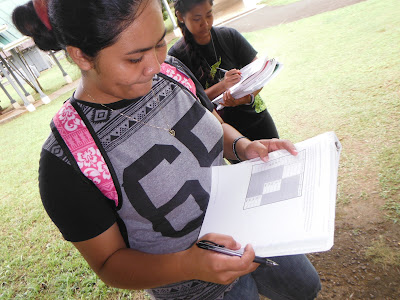
During the fall term the diagonal layout of the table necessary to produce three lines on one graph in a spreadsheet (because the x-values are no longer fixed as their were in the original version of this lab), confused the students. I used a preprinted table to help the students organize their data in the field. This should be printed with the "Print Background" option set to "on."
Both sections obtained linear data. The reduction to two speeds (along with a stationary ball) also simplified the laboratory while retaining the core learning goal that slope is speed. Students really struggle with the abstract connection between lines on a graph and a physical reality.
Bee Hartly Siba with the new data recording table
I also shifted from the procedure of calling out times and having students note where the ball was at a particular time. Although this made time the independent variable, and distance the measured dependent variable, there was always an issue with the first second being longer than the other seconds. Years of trying to find way to minimize this error never yielded fruit. For some reason premarking distances and measuring time to the distance marks generates a more linear result. Probably in part by shortening the duration over which measurements occur. All curves look flat over short enough distances.
Samantha Sigrah reporting times to Liana Benjamin
During the fall term the diagonal layout of the table necessary to produce three lines on one graph in a spreadsheet (because the x-values are no longer fixed as their were in the original version of this lab), confused the students. I used a preprinted table to help the students organize their data in the field. This should be printed with the "Print Background" option set to "on."
Hellen Tilfas pitches
Beverly-Ann Robert records data
Andy transcribes data from one sheet to another
Data sheet for the second laboratory
Both sections obtained linear data. The reduction to two speeds (along with a stationary ball) also simplified the laboratory while retaining the core learning goal that slope is speed. Students really struggle with the abstract connection between lines on a graph and a physical reality.


Comments
Post a Comment