Sound speed with resonance tubes
With the near equatorial trough rebuilding across eastern Micronesia, rain heavy enough for a flash flood warning was coming down.


 Hartsey and Jefferson seeking resonance
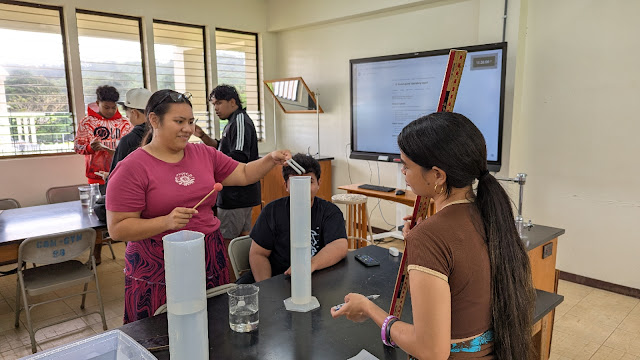
 Ensalyn and Ternajen checking their resonance point
 Susan listens for resonance

 Josh finding the resonance, Denny-Ray records data while John observes
 Josh measuring the resonance distance


 Melsihna works with the tuning fork, Vanetter records data
 Tayshaun records data as Jay-brion adds water from an Erlenmeyer flask

In this laboratory frequencies below 256 Hz and above 512 Hz were explored using cell phone apps and the Smartboard. Running a signal generator on the smart that graphically allowed varying the frequency achieved full tube resonance at 149 to 150 Hz. The speakers attached to the smartboard were necessary to produce this low frequency. Apps on a smartphone generated higher frequencies and made finding resonance easier because the tone was continuous.

The water, however, was off at the college. On a day when the indoor version of the lab requires a lot of water. The above technique worked the best.
Erlenmeyer flasks were a flat oil fail along the stop line due to wind and standing water. They floated unstably and keeled over with the next round gust.
These proved to be able water catchers and provided a sufficient source of water for the lab.
The students would need all of the tall graduated cylinders as water storage for each group. Each group needed a resonance tube and a water storage tube. This term the meters sticks were not forgotten.

The Erlenmeyer flasks were noted to be too noisy in the past and that proved true again this term. The spout on a beaker permits more pouring control, including pouring onto the inner side wall of the graduated cylinder. This is harder to do with an Erlenmeyer flask. They invariably pour down tube generating more water impact noise than a beaker.
Susan and Sonya
The 1000 ml beakers were a must have item.
Cathleen check for resonance, Kimberly records resonance distances
Ioanis tests for resonance, Melsihna, Silane, and Matuita looking on
Gaynor pours water as John holds the tuning fork, Shyann
In this laboratory frequencies below 256 Hz and above 512 Hz were explored using cell phone apps and the Smartboard. Running a signal generator on the smart that graphically allowed varying the frequency achieved full tube resonance at 149 to 150 Hz. The speakers attached to the smartboard were necessary to produce this low frequency. Apps on a smartphone generated higher frequencies and made finding resonance easier because the tone was continuous.

1024 Hz and 149.5 Hz greatly extend the range and make more apparent the hyperbolic nature of the curve.


Comments
Post a Comment