Linear velocity
Monday began with my asking the students what shape the line of a constant velocity would make on time versus distance graph. A student suggested a triangle pointing up.


 A velocity of two meters per second was achieved.


Another student disagreed, using their figure to trace a smooth curve in the air. I then added the eyes and eyebrows.
Then I went out and rode the RipStik for 30 meters, timing every three meters.
The data was extremely linear this term.
The smiley face with the upward triangle nose would prove useful during the week. Here I demonstrated that the shape could be generated by mathematics. Math can make that shape.
Wednesday was used to introduce the stopwatches and measure walking speed.
Sonya walking while using a smart phone to record split times.
Fumie-Kate successfully tried the blue RipStik.
The blue RipStik was revived using wipes and WD-40.
Start of class Thursday.
As 8:00 I rolled the ball eastward. There was no wind, so eastward runs worked out well enough.

Fumie-Kate tries bowling the four square ball
Only one student had a laptop, the rest worked from phones.
Working on their phones.
Three more using Desmos on their phones.
The board at 11:00
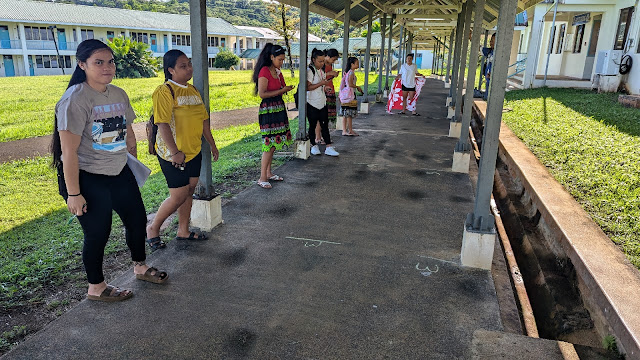
The class lined up to take data
A recorder and a timer using her phone to time.
I had also resurrected the red board, and while one wheel is not quite rolling fully freely, the board was rock steady on all three runs in the afternoon. The board felt more stable that my gray boards. I opted to use a RipStik in the afternoon because I get more control over the speed and track. Slow runs were 0.9 m/s to 1.1 m/s, medium runs were 1.8 to 2.0 m/s. My fastest runs were 2.89 to 3.23 m/s.
Friday again included coverage of what the laboratory report for the second laboratory should look like. Friday also included a look at the Bernoulli effect and at the Magnus effect to wrap up the week.


Comments
Post a Comment