7.1 7.3 Random distribution of beads
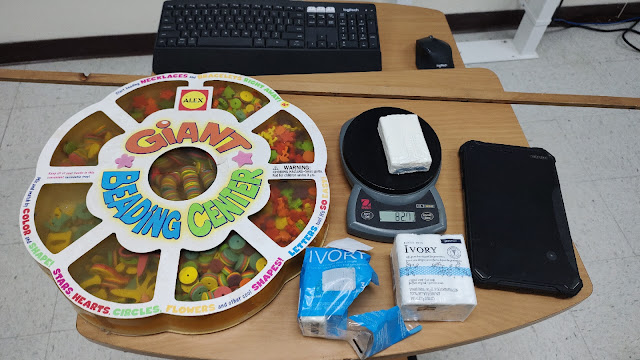
I modified the 7.1 introduction to the normal curve by beginning with five bars of 90g Ivory soap.
The intent was to show that any measurement varies randomly.

The complication was that two bars were significantly older than the other three bars. And as I discovered years ago, soap does slowly sublimate. Soap loses mass over a period of years. Despite the low mass, the two older bars were marked as being 90 gram bars of Ivory soap.

This led to a strongly bimodal distribution. Soap of the same age and more bars of soap might have better illustrated a normal distribution.

The above photo was after counting the beads. This term I did not stand on anything. I just stood and tossed the beads.

This term I again only looked at the distribution horizontally.


The distribution was nicely normal with 215 beads thrown.
%20and%20normal.png)
Smoothed out (the blue line) the distribution is only very slightly leptokurtic with a kurtosis of 0.074. Desmos was used to show that the red curve can be produced by just two values: the mean and the standard deviation.

Based on notes from last term, changing examples between 7.1 and 7.3 is confusing for the students. So I used Desmos based on the bead distribution to cover 7.3, areas under the normal curve.


Comments
Post a Comment