Conservation of energy
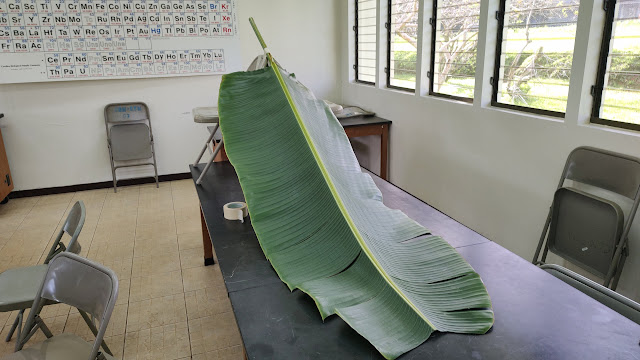
Twas the night before the conservation of energy laboratory and all through the lab the banana leaves were arranged.
A sign was left in the hopes that the cleaning crew would read and leave the leaves alone.
The next morning the leaves were gone. I knew the trade winds had destroyed most of the leaves, I had taken the last of the usable ones. And the area was wet, muddy, full of ants. With a long day ahead including the arrival of the new president, this was no day to be sweaty, muddy, and wet. I stared out on to the lawn for a while trying to figure out what to do.
Ravenala madagascariensis. I had never looked to see if the petiole had a groove that a marble could roll in. I went to cut them and discovered that they are full of rain water between the petioles. A lot of rainwater.
Turns out that the petiole has a closed groove, but the rachis in the blade has an open groove. The blade length is less than a large banana leaf, so overall heights maxed out at 65 to 75 centimeters.
The petiole was trimmed. In some sense these leaves work better - they have a stiffer petiole/rachis than a banana, sag less, and hold up better. This term I managed to remember the stopwatches, the masking tape, the scissors, the scotch tape, the tape measure, and marbles.
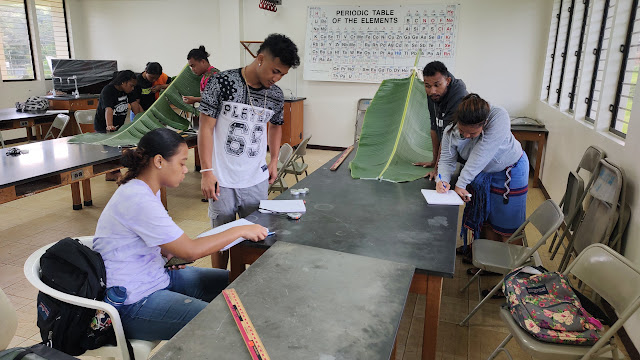
I opened by noting that while we had shown that a falling ball falls with increasing velocity as height increases, we could not measure the velocity with which the ball hits the floor. The leaves would change the direction so we could measure the speed using a speed trap. I then ran a demonstration including the use of three meter sticks to determine height above the table - this has produced data which is much more consistent with the theory and all but eliminates height errors.
I had run the calculations at 5 cm and a couple calculations at ten centimeters. At each height five times were taken, the median was used to calculate the speed. This too has a beneficial impact on the accuracy and consistency of the data. This laboratory used to use single times at every 10 centimeters and a speed trap that was lengthened as speeds increase. This approach led to data that did not clearly show a square root relationship. The results were unpredictable. Shifting to the median time for five trials at fewer heights, with heights doubling up the ramp, has had a strong positive impact on the consistency of the data. Getting a lab to work consistently is a multi-year effort. The details make all the different. The board above also notes that the southern speed trap is 138 centimeters. Data beyond 10 cm was from student measurements.
With all of the groups done and the data confirming a square root relationship, I went ahead and showed them the underlying theory, minus the component of rotational kinetic energy. Note that for g I reached back to the data from the prior week. I did not use the published value as the class median value of 10.055 meters per second squared is sufficiently close.
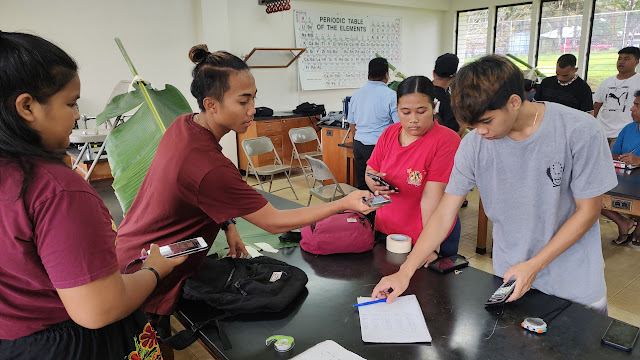
Data from the two morning teams. This lab lends itself well to slightly larger groups, although two group can work on a single ramp.


Comments
Post a Comment