Student evaluations fall 2021
Students predominantly in online courses anonymously submitted responses to a survey. Students were instructed to fill out the survey once for each course they were in. 814 surveys were submitted. The following are broad indicators of areas of relative strength and weakness using a modified form of a t-statistic as a metric.
Instructor evaluation

The horizontal access for the chart above is essentially a form of a t-statistic. The value is the number of standard errors for the mean above or below the overall mean for that particular average. Areas of strength are denoted by green bars and extend above positive two standard errors on the right. Areas of relative weakness are denoted by red bars and extend below negative two standard errors on the left.
Course evaluation

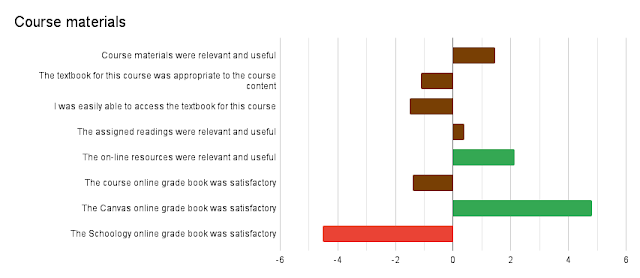
Course materials evaluation
Preferred mode of learning

Would you want to take online courses next term?

Discussion
With 814 survey submissions to date, the evaluations already provide a substantive sample to work with. The online evaluations were primarily, but not exclusively, given in online courses. The underlying data indicates that some faculty in residential courses opted to share the link to the online evaluation.
A key capability of the online evaluation is the potential to turn around results almost immediately. The ability to react to data in near real time is the hallmark of an agile institution. Just as students benefit from timely feedback, so do faculty and administrators. Online evaluation provides data strengths and weaknesses that can be addressed almost immediately. In the past, paper based evaluation of the prior term often arrived during the following term. This document delivers the data before the term being evaluated has concluded. In theory, an instructional trainer could now swing into action to deliver "just in time" training to faculty ahead of the next term.
This report provides evidence for anecdotal student reports that faculty do not maintain regular, timely contact with the students. Feedback is not arriving in time for students to prepare for the next assignment or assessment in the course. The challenge from the faculty perspective is that there are "no days off" in an online course. Assignments arrive seven days a week, literally around the clock. Holidays and weekends have no particular meaning in cyberspace, especially when a holiday in one state is not a holiday in another state.
Course syllabi received a strong favorable rating. Online courses, however, were not seen as providing the same value as a face-to-face course. As measured by relative standing, this was a very strong negative reaction to the statement "This course delivered online was equal or better value than if I had taken it face-to-face." This was the strongest negative reaction in the survey.
Students found that the online resources provided were relevant and useful. The metric "The course online gradebook was satisfactory" received a slightly negative rating relative to the overall mean. Since there were two platforms in use, Schoology and Canvas, separating that data out provided insight into which, if either, platform was driving the relatively negative rating. The split away from the overall mean for each platform was surprisingly strong. Canvas received a strong positive relative response while Schoology received an almost equally strong negative response relative to the overall mean. There were more students using Schoology, thus the overall rating was negative.
Bearing in mind that the evaluation was dominantly completed by students in online courses, there is perhaps less surprise that almost two thirds of the students prefer online classes. Three-quarters of the students would take online classes next term. The four percent neutral include students who said that they are graduating or who expressed a neutral position on the question.
A note on the methodology used to construct the charts. Looking at the raw averages for each metric does not always produce a clear picture on whether a particular mean is unusually high or low. The students have a tendency to mark all "fours and fives" which leads to averages between four and five. Only "This course delivered online was equal or better value than if I had taken it face-to-face" dipped just barely below four. In other words, a score of four is used as a relative "ding" by students. Thus in the above report the use of language such as "strong negative reaction" should be viewed with an understanding that this statement refers to the distance away from the overall mean.
Each section's relative scores were calculated against the mean and standard error for that section.
Instructor average: 4.42
Course average: 4.32
Course materials average: 4.35
All three sections average: 4.368
These overall averages are, at face value, generally good ratings. The key is to understand the differences, the distance from the mean. By using a form of t-statistic, essentially a z-score but with a standard error of the mean in the denominator, one can begin to tease out when a metric is unusually high (above positive two) or unusually low (below negative two). This provides information useful to addressing areas of faculty weakness, useful to designing training to meet their needs.


Comments
Post a Comment