Photo essay of presentations in statistics
This term featured eight open data exploration presentations, one more than in the prior term, spring 2019. At the end of the term the students responded that they had learned the most when preparing and presenting. The presentations have become a core element of both instruction and assessment in the course. The following is a glimpse into some of the presentations.
The first day of class each student was given a bag of MMs and told to prepare a presentation for Friday based on the following questions:


The second presentation of the term was a look at the basic statistics for resting heart rates versus post-exercise heart rates.

The third presentation explored the relationship between drop height and bounce height for a small plastic ball.


FiboBelly ratio presentations: could the class sample come from a population with a mean ratio of 1.618?


Plastic in amphipods explored whether amphipods in the different oceanic trenches had differing amounts of plastic found in them.


The first day of class each student was given a bag of MMs and told to prepare a presentation for Friday based on the following questions:
- Before opening your bag, determine the weight of each bag.
- Does the weight match the weight printed on the bag?
- How many M&Ms in your bag?
- Is the number of M&Ms the same in each bag?
- What might be the average number of M&Ms in a bag?
- How many colors are there in a bag?
- How many MMs of each color are there?
- Which color is there the most of?
- Make a chart showing the number of MMs of each color in a bag. If you are working with a partner, make a chart for each bag.
- Is the number of MMs of a particular color the same in every bag?

Lynn


Valiva and Atasha have sorted their MMs by color

JR and Don study the information on the bag

Mermi and Sharon report their findings

Letisha and Ashley
The second presentation of the term was a look at the basic statistics for resting heart rates versus post-exercise heart rates.

Zianne
The third presentation explored the relationship between drop height and bounce height for a small plastic ball.

Jolynn and Michelle

Dickson and KP

Shawna Mae

Kawika and Letisha

Roxsan and Jolynn, five marbles demonstration
FiboBelly ratio presentations: could the class sample come from a population with a mean ratio of 1.618?

Atasha and Sharon
Sharon

Valiva and Shawna Mae

Valiva

Roxsan weaving a mwarmwar of Hedychium coronarium


Evans and Kilisou

Zianne

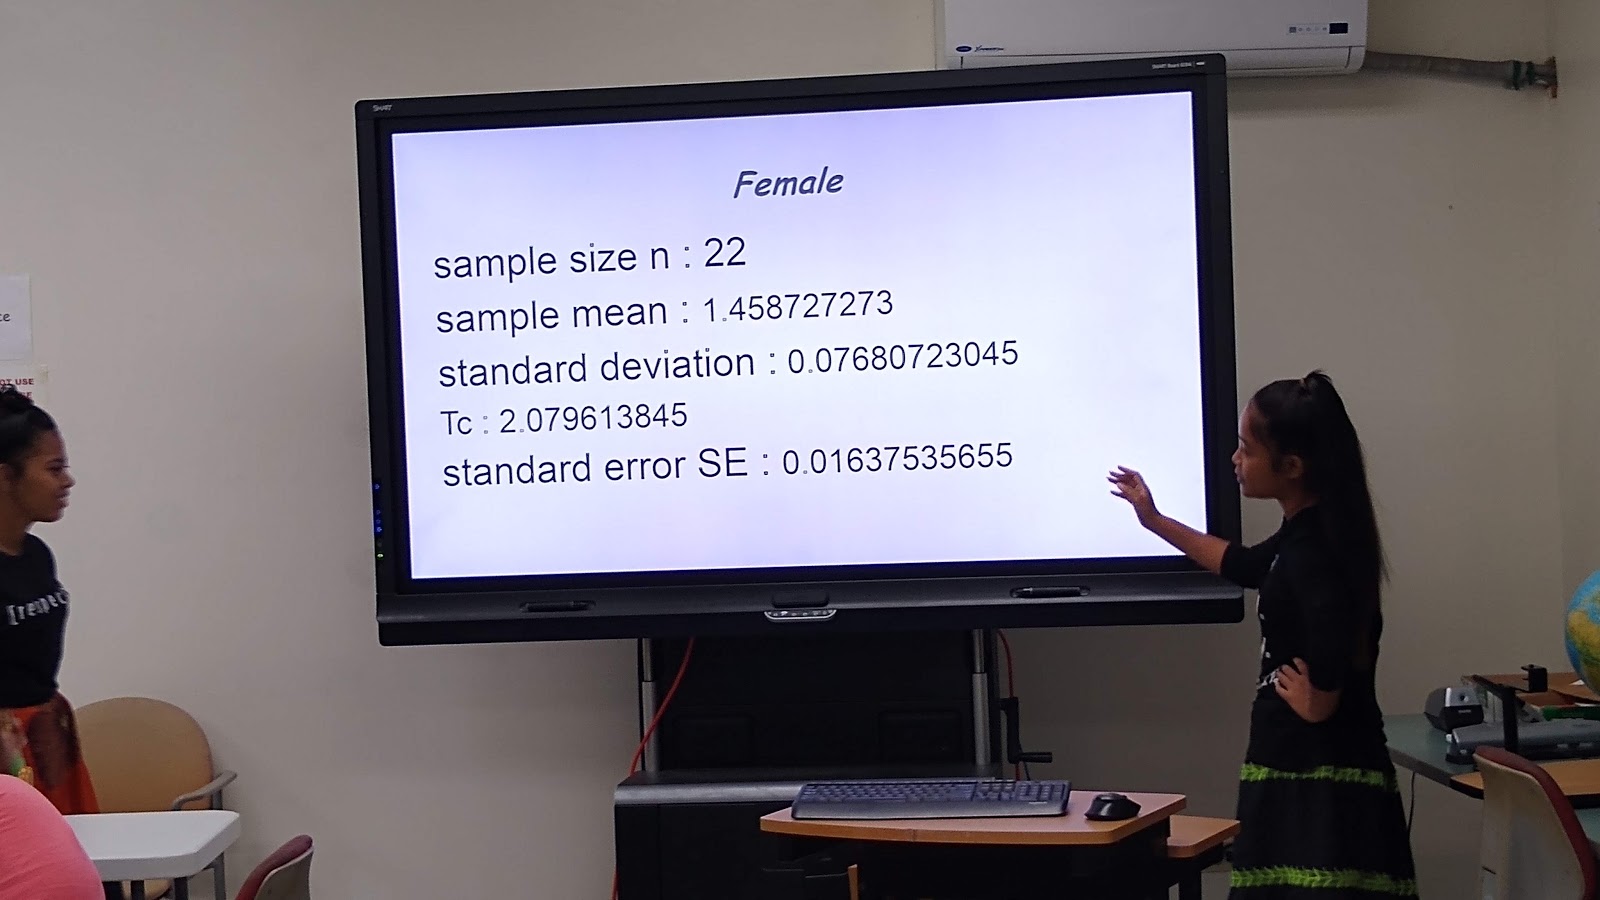
Zianne covers basic statistics for females and males including confidence intervals

Plastic in amphipods explored whether amphipods in the different oceanic trenches had differing amounts of plastic found in them.

Millanie Mae "Mulan"


Belinda and Winona

Boxplots for the amphipod plastic content

Kathrine and Ethan

Ashley and Letisha

Atasha

Zelain on the relationship between carbon dioxide and local temperatures


Marciarose and Ladonna

Mermi and Millanie Mae Mulan cover carbon sequestration under trees

Zelain


Comments
Post a Comment