Linear motion
Linear motion began as I began fall 2018, by pre-marking a 30 meter stretch of sidewalk at three meter marks. The shift to meters was documented as being helpful fall 2018.

I intentionally came in slow with no acceleration on the downhill from the LRC, using gravity only. I then did a slow swizzle to offset the slowing effect of the flat portion of the sidewalk.
 This yielded a very slow 1.53 meter per second run, and the linearity was excellent. Note that with a slope near one, the graph axes do not have to be "desquared" - basic screen "pinching" shows the graph. The use of centimeters prior to fall 2018 proved problematic - students inevitably obtained what appeared to be a vertical line on the y-axis because the distance was in thousands of centimeters (as in 3000 cm!) and the time was on the order of two seconds or less.
Wednesday remains a challenge, the segue to the laboratory remains an area of development. This term I brought running shorts. Rather than deal with setup and tear down of the laptop, I opted to produce a handout of the Monday RipStik run (data seen in the image above). I then took a slightly different tack from prior terms. Over the years I had a gained a sense that students still did not grok velocity by the end of the second week, that I needed to spend more time with the mere concept of speed. I modified an activity from the past - I explained that I wanted to give the students a better sense of what speeds in meters per second mean at a personal level. I also wanted the students to learn to use the chronographs - something that often complicates the lab on Thursday.

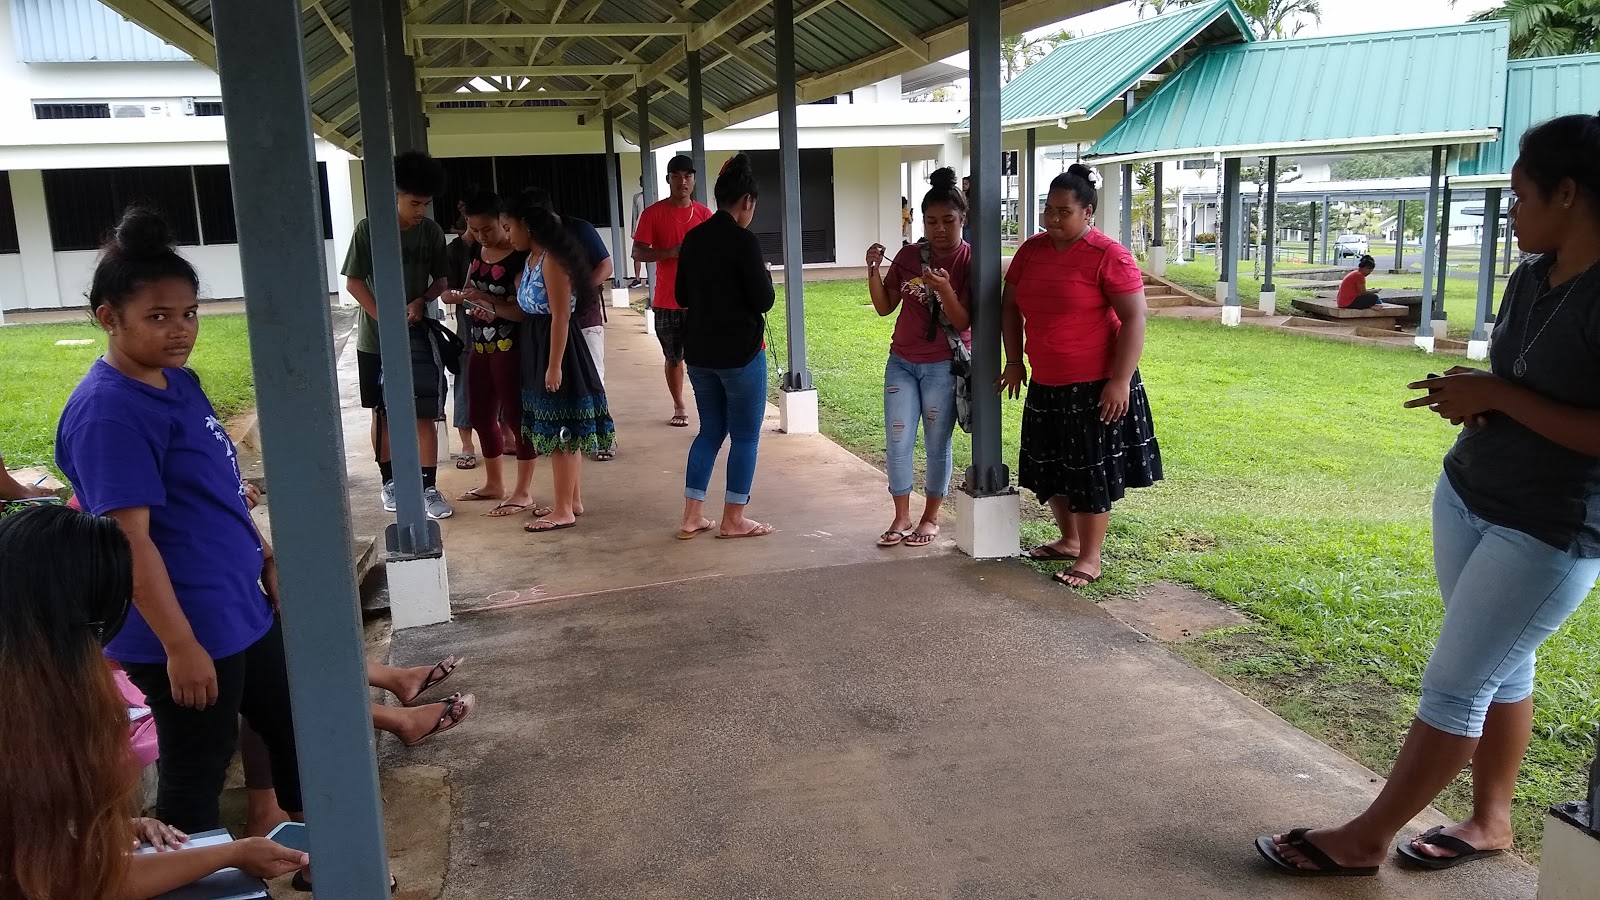
I explained lap and split times and how to use the chronograph in class. Then I had the students walk 30 meters, timing their 3 meter "lap" times as they went. I did not have them make a graph - just calculation 30 meters divided by their time to get their speed. At least three students inverted the calculation dividing their time by 30 meters. This caught me off guard and reinforced my sense that the activity today was worthy: there were students who were not understanding the nature of speed as a distance divided by time.


A failed attempt at a selfie while riding the RipStik: forgot to switch to the front camera
I intentionally came in slow with no acceleration on the downhill from the LRC, using gravity only. I then did a slow swizzle to offset the slowing effect of the flat portion of the sidewalk.

Wednesday remains a challenge, the segue to the laboratory remains an area of development. This term I brought running shorts. Rather than deal with setup and tear down of the laptop, I opted to produce a handout of the Monday RipStik run (data seen in the image above). I then took a slightly different tack from prior terms. Over the years I had a gained a sense that students still did not grok velocity by the end of the second week, that I needed to spend more time with the mere concept of speed. I modified an activity from the past - I explained that I wanted to give the students a better sense of what speeds in meters per second mean at a personal level. I also wanted the students to learn to use the chronographs - something that often complicates the lab on Thursday.

I explained lap and split times and how to use the chronograph in class. Then I had the students walk 30 meters, timing their 3 meter "lap" times as they went. I did not have them make a graph - just calculation 30 meters divided by their time to get their speed. At least three students inverted the calculation dividing their time by 30 meters. This caught me off guard and reinforced my sense that the activity today was worthy: there were students who were not understanding the nature of speed as a distance divided by time.
Thursday the class rolled a ball at three different speeds along the sidewalk gathering data for a slow ball, a faster ball, and a fastest ball speed.

This term the 8:00 fastest ball and all three 11:00 lab ball rolls were done from east to west due to a moderately strong east wind.

This worked well as the amount of upslope is very small and the wind more than offset the slight upslope. The familiarity with the chronographs gained on Wednesday proved useful on Thursday. Note too that this term the class was on the sidewalk on Monday and Wednesday, which helped the students find the class on Thursday. Thursday's class started on the sidewalk at both 8:00 and 11:00, there was no "start up" in A101 or pre-lecture.


Comments
Post a Comment