Assessing general education science program learning outcome 3.5
General education science program learning outcome 3.5 states that students will be able to:

While the overall average number of laboratory reports runs at 7.25 per class and is just under eight reports for 2017 and 2018, the average obscures the wide variation underneath the average. Some classes require only a single laboratory report during the term, opting for other means of measuring learning in the course. Some classes require as many as 15 reports during the term. Note that here class is being used as described above: a course being taught on a campus by an instructor.

There was a negative correlation between completion rates and the number of laboratory reports assigned. The rate of decline in the completion is -2% per additional lab report. Though the rate of decline is small, the decline is statistically significant.
Each science with laboratory is unique and different. The number of reports which is appropriate will differ from course to course, section to section, and from site to site. Ultimately instructors have to determine how to best deliver their subject area and achieve the learning outcomes.
The rates of successfully completed laboratory reports and the number of reports completed by a student provide evidence that students have performed experiments that use scientific methods as part of the inquiry process.
Perform experiments that use scientific methods as part of the inquiry process.
This outcome serves institutional learning outcome eight quantitative reasoning where students will demonstrate the:
Ability to reason and solve quantitative problems from a wide array of authentic contexts and everyday life situations; comprehends and can create sophisticated arguments supported by quantitative evidence and can clearly communicate those arguments in a variety of formats.
Taken together, the assessment for program learning outcome 3.5 ought to provide evidence of an ability to create data supported documents that communicate results of experiments performed using scientific methods. In science classes with a laboratory component, laboratory reports provide documentation of students engaging in gathering data, analyzing data, and discussing results. The laboratory reports may also include tables of data and graphical elements such as charts, thereby also serving institutional learning outcome two: effective written communication where students will demonstrate the:
Development and expression of ideas in writing through work in many genres and styles, utilizing different writing technologies, and mixing texts, data, and images through iterative experiences across the curriculum.
Instructors of science laboratory courses were asked to provide the following information:
- Which of your courses, if any, have students performing experiments that use scientific methods as part of the inquiry process?
- How is this documented in the course?
- If the documentation consists of laboratory reports, how many reports are assigned during a term?
- How many students are in the course?
- What is the completion rate for laboratory reports in the course?
The instructors were given the following additional guidance, "In this completion rate I would not include reports submitted that did not meet a minimum standard as set by you in your course.
As to what constitutes a laboratory report, my own definition would be a stand-alone document with an introduction, body, and conclusion."
In this report data derives from three courses: SC 117 Tropical Pacific Island Environments, SC 120 Biology, and SC 130 Physical Science taught on five campuses in 16 classes between fall 2016 and fall 2018. 349 students were in these classes. Due to the small sample size a single term represents, and that some campuses only teach a particular course once a year, for this report data is aggregated in across the time frame fall 2016 to fall 2018. Note that classes are not the same as sections, some classes consist of two sections of the course. A class in this report refers to a specific course on a specific campus.
Future reports may have enough data to provide disaggregated results by course across multiple academic years. This is only the second year in which this report has been produced. A limited amount of 2016 academic year data was submitted in 2017 and was included in this report.

There is wide variation in the number of reports required by course. That said, this report did not seek to examine differences in report complexity. A course such as SC 130 Physical Science at the national campus has 12 written reports during the term. These reports are usually a single draft, with only a few students submitting a revised second draft. The report includes no outside research or citations. A course with fewer reports might involve multiple drafts, outside research, and citations. The raw number of reports does not reflect the complexity per report. Given that proviso, there is a still a wide variation in the number of reports required across courses.

The average completion rate chart "inverts" to some extent the number of reports data: courses with fewer reports have relatively higher completion rates.


The average completion rate by campus is also impacted by small underlying sample sizes for some campuses. There is also the complication that while raw submission rates may be high, laboratory reports that meet a minimum standard of quality may be lower. In one instance a 97% raw submission rate yielded only 68% meeting a minimum standard of quality. These charts reflect only those reports that met the standard set in the class.

Future reports may have enough data to provide disaggregated results by course across multiple academic years. This is only the second year in which this report has been produced. A limited amount of 2016 academic year data was submitted in 2017 and was included in this report.
Analysis by course

Chart 1: Average number of reports by course system-wide 2016 to present

Chart 2: Average report completion rate by course system-wide 2016 to present
The average completion rate chart "inverts" to some extent the number of reports data: courses with fewer reports have relatively higher completion rates.
Analysis by campus

Chart 3: Average number of reports by campus
These numbers are perhaps not as comparable as they might appear. For example, underneath the Kosrae campus value is a single summer section of SC 130 Physical Science taught in the summer of 2018.

Chart 4: Average completion rate by campus
The average completion rate by campus is also impacted by small underlying sample sizes for some campuses. There is also the complication that while raw submission rates may be high, laboratory reports that meet a minimum standard of quality may be lower. In one instance a 97% raw submission rate yielded only 68% meeting a minimum standard of quality. These charts reflect only those reports that met the standard set in the class.
Analysis by academic year

Chart 5: Average completion rate by academic year. 2016 data was highly incomplete.
Setting aside academic year 2016 to 2017, the average completion rate held steady at just under 80% for academic years 2017-2018 and 2018-2019. Note that this data was first gathered in fall 2017 and is usually fall term data. In some instances where a general education science with laboratory course is only taught in the spring on a campus, spring data was submitted.

Chart 6: Average number of reports per year system including minimum number per class and maximum number per class. 2016 data is incomplete.
Analysis of number of reports versus completion rates
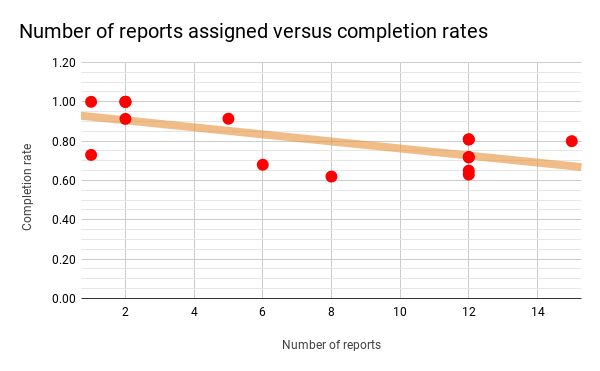
Chart 7: Number of reports assigned versus completion rates
There was a negative correlation between completion rates and the number of laboratory reports assigned. The rate of decline in the completion is -2% per additional lab report. Though the rate of decline is small, the decline is statistically significant.
Each science with laboratory is unique and different. The number of reports which is appropriate will differ from course to course, section to section, and from site to site. Ultimately instructors have to determine how to best deliver their subject area and achieve the learning outcomes.
The rates of successfully completed laboratory reports and the number of reports completed by a student provide evidence that students have performed experiments that use scientific methods as part of the inquiry process.


Comments
Post a Comment