Density of soap tested in the river
Laboratory one at the Kosrae campus was an investigation of the density of soap. Soaps in use included Ivory, Dial Basic, and a slab rectangular Jergens beauty bar. With data gathered in the science lab, the class moved to the computer lab. The advantage of the start the week ahead of regular classes is that the computer laboratory is available to the class.
The students used Desmos to find the slope of the volume versus mass line and thus the density of the soap. The students predicted that the Ivory and Jergens would float, and the Dial Basic would sink. The Kosrae campus is blessed with a river in the front yard, and thanks to the agriculture program and maintenance, has a new bridge over that river, a perfect place to test the soap.
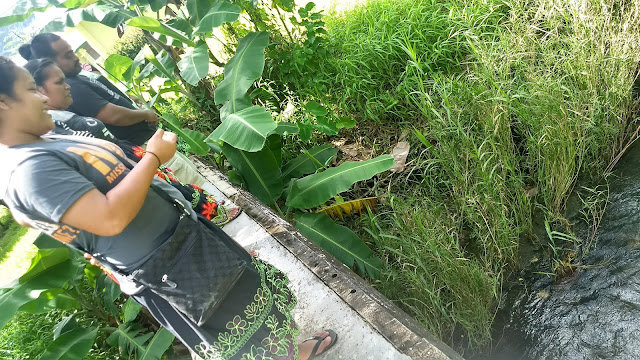
The soap behaved as predicted confirming the mathematics of the experiment. The Dial Basic sank. A piece of Dial Basic that came in at 0.99 g/cm³ was deemed neutral buoyancy and indeed seemed to hover in the water before sinking ever so slowly.

Floating soak visible on the surface, small chunks. The ones that sank cannot be as clearly seen.
Tech presented the greatest challenge in the class. Schoology simply loaded too slowly to be used from the Kosrae campus. I quickly abandoned any plan of using Google Drive Assignments and Schoology and opted to shift to the one element that was loading efficiently: Google Docs. Desmos plus Google Docs will be the software stack this summer.

With the possibility of using smartphone screen capture and image insertion in smartphone based Google Docs. Submission is tentatively planned to be via sharing. Because of the bandwidth issues for both the students and I, along with the novelty of the tech stack, the class will return to an earlier practice of one full laboratory report per week.

Although many students have Gmail and thus can use Google Docs, some do not and this will prove a challenge. Flexibility will be necessary moving forward.


Comments
Post a Comment