Affective domain assessment of the use of Desmos and Google Drive Assignments/Google Docs in physical science
Eighteen students in SC 130 Physical Science responded to a survey on the use of Desmos graphing calculator and Google Drive Assignments/Google Docs (GDA). The students used Desmos to enter data gathered during laboratory experiments and to run regressions against their data. The resulting graph and regression analysis were included in a report prepared using Google Docs and submitted via Google Drive Assignments inside of Schoology Institutional.

Desmos permitted the students to work on desktop computers, laptop computers, tablets, or, via the Desmos app, on a smartphone. Desmos has both website versions that run in a browser and an app for Android and iPhone that functions with or without an Internet connection. With a connection Desmos can save to the cloud.

The Desmos smartphone app can run regressions against arbitrary functions even when not connected to the Internet. In the above image the data is being regressed against an acceleration of gravity formula. Note that Desmos permits the use of the variables used in physics rather than being limited to x and y variables. For all of the students, this was their first time to use Desmos.


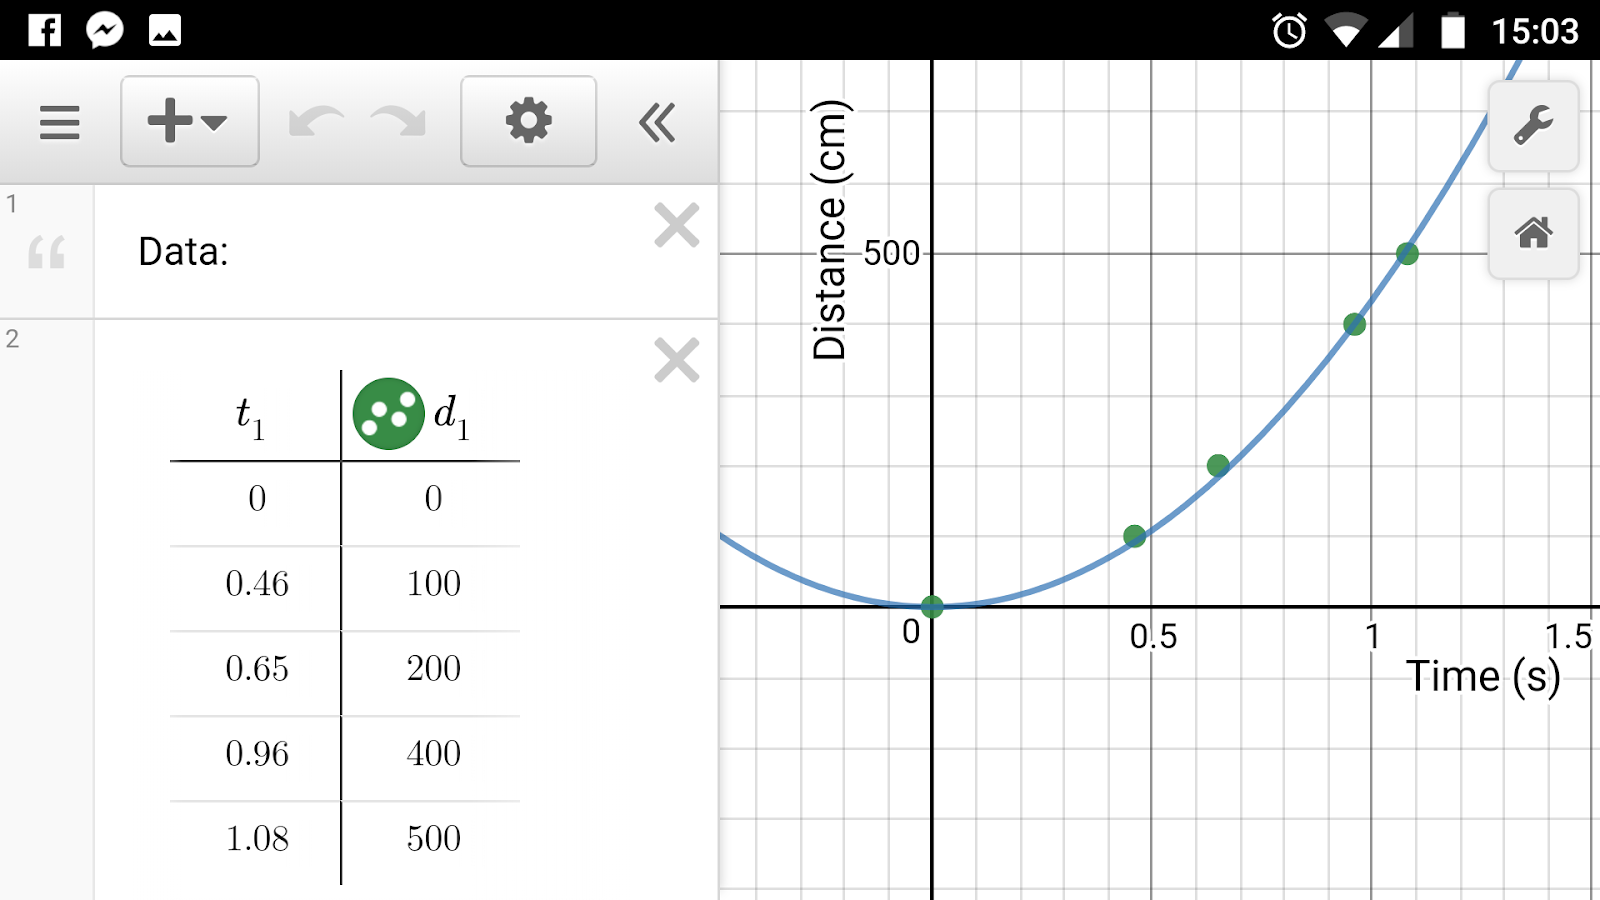
Data entry in a table and graph in Desmos

Regression analysis of data in Desmos
The Desmos smartphone app can run regressions against arbitrary functions even when not connected to the Internet. In the above image the data is being regressed against an acceleration of gravity formula. Note that Desmos permits the use of the variables used in physics rather than being limited to x and y variables. For all of the students, this was their first time to use Desmos.

Desmos table and graph in Google Docs document
The tables and graphed entered into Desmos were then imported as images into Google Docs where the students worked on their introduction, procedure, analysis, discussion, and conclusions.

In response to the question, "What did you like about Desmos graphing calculator?" students predominantly responded that Desmos was easy to use. Four students noted that Desmos was fast, as in faster to generate a graph than a spreadsheet program. Desmos starts plotting points as the data points are entered. With a spreadsheet the plotting only happens after the data has been entered. The students perceived Desmos as being faster in this sense.

When asked what they did not like about Desmos, the students often put "Nothing." Some did note that at first they did not know how to "operate" Desmos. A couple of students noted that they found determining the appropriate equation to be difficult. One student apparently tired of data entry tasks.
In general, the students responded positively to Desmos graphing calculator. No student had issue with the software, their few challenges were in what equation to use and data entry.
Students were also asked what they liked about using Google Drive Assignments/Google Docs.

The most frequent response was the automatic saving inherent in Google Docs. The students noted that they did not have to worry about losing their work, Google Docs always saved everything automatically. The students also reacted positively to the lack of a need for a flash drive. One student expressed the opinion that Google Docs is easier to use than Microsoft Word.

For most, if not all, of the students, Google Docs was a new program. Many students had to sign up for a Google account to even use Google Docs. Thus I was surprised to note that the majority of students responded that there was nothing they did not like about Google Docs. Of 18 students, 14 responded that there was nothing they disliked about Google docs. Given that the students usually worked in Microsoft Word, the absence of dislikes is perhaps a testament to ease with which the students switched to using Google Docs.
The few issues that students did have were related to network issues or the nature of a cloud based service and not the software per se. One student noted that Google Docs could be slow to load, one noted the need to remember a password, and a third mentioned that the program requires the Internet to work. That said, the overwhelming response was that students were able to use Google Docs and liked the sense of file security that automatic saving brought. No student indicated that the transition from Word - that with which the students would be most familiar - was difficult.
Both Desmos and Google Docs were well received by the students in physical science.


Comments
Post a Comment