Favorite numbers 95% confidence interval fails to capture the population mean
An attempt to use favorite numbers to generate samples and populations to demonstrate 95% confidence intervals led, inevitably, to failure to capture the population mean.

In the 8:00 class I attempted to generate the data wholly internal to the section. I distributed thirteen pieces of paper, three of which were pink. I attempted to use the pink sheets to capture the population mean for all 13 favorite numbers. This worked, but only because at a sample size of 3 the t-critical for a two-tailed 95% confidence interval is 4.3. This only really proved that with a small enough sample size anything can be proven to be true.

The confidence interval ran from -4 to 31, a range that will certainly capture the mean favorite number unless a clever student drops a statistical bomb such as a favorite number of a few million and change. And that is the difficulty with favorite numbers - they include high outliers.
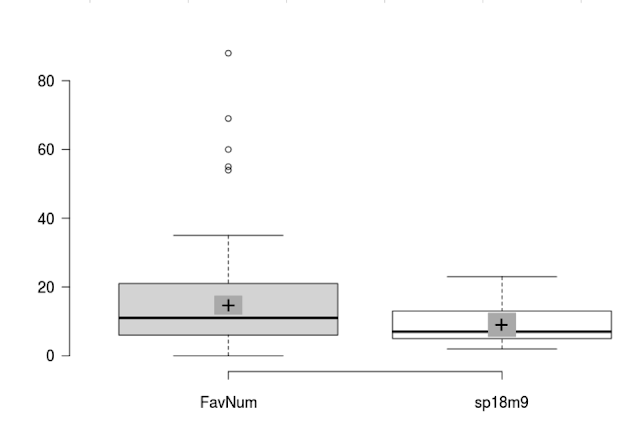
At 9:00, to end run the problem of sample sizes less than five I used the section as the sample data and a pre-existing list of favorite numbers along with the section numbers as the population.

With a more reasonable t-critical, this generated a confidence interval from 5.6 to 12.4 that failed to capture the population mean of 14.7.

Underlying this failure was the existence of high outliers in the population which were not present in the sample. Yes, I am keenly aware that a single section is not a random sample of the population because not all values are equally likely to be selected into the sample. But to then run the machinery to randomly select numbers from the population would add a layer of hocus-pocus to the demonstration.
Thus I should not expect to capture the population mean. I usually fall back on the paper aircraft data at this point in the term to show capture of a population mean using a sample. For that data I have an 83% success rate of capturing the population mean using a 95% confidence interval. The success rate below 95% is due, oddly enough, to El Niño.

In the 8:00 class I attempted to generate the data wholly internal to the section. I distributed thirteen pieces of paper, three of which were pink. I attempted to use the pink sheets to capture the population mean for all 13 favorite numbers. This worked, but only because at a sample size of 3 the t-critical for a two-tailed 95% confidence interval is 4.3. This only really proved that with a small enough sample size anything can be proven to be true.

The confidence interval ran from -4 to 31, a range that will certainly capture the mean favorite number unless a clever student drops a statistical bomb such as a favorite number of a few million and change. And that is the difficulty with favorite numbers - they include high outliers.
At 9:00, to end run the problem of sample sizes less than five I used the section as the sample data and a pre-existing list of favorite numbers along with the section numbers as the population.

With a more reasonable t-critical, this generated a confidence interval from 5.6 to 12.4 that failed to capture the population mean of 14.7.

Underlying this failure was the existence of high outliers in the population which were not present in the sample. Yes, I am keenly aware that a single section is not a random sample of the population because not all values are equally likely to be selected into the sample. But to then run the machinery to randomly select numbers from the population would add a layer of hocus-pocus to the demonstration.

Thus I should not expect to capture the population mean. I usually fall back on the paper aircraft data at this point in the term to show capture of a population mean using a sample. For that data I have an 83% success rate of capturing the population mean using a 95% confidence interval. The success rate below 95% is due, oddly enough, to El Niño.


Comments
Post a Comment