Assessing Learning in Introductory Statistics
MS 150 Statistics is an introductory statistics course with a focus on statistical operations and methods. The course is guided by the 2007 Guidelines for Assessment and Instruction in Statistics Education (GAISE), the spring 2016 draft GAISE update, and the ongoing effort at the college to incorporate authentic assessment in courses. A history of the evolution open data open data exploration exercises and associated presentations as authentic assessment in the course was covered in a May report.

The first twenty-two questions are course material. Questions 23 and 24 are material not covered in the course, questions 25 to 28 were conceptually covered but were based on the results of 23 and 24.
On core course material, the students performed exceptionally well. Only the calculation of the margin of error and the sample size for paired data underperformed.
Question 23 presented the students with a formula to calculate t-critical for paired data, TINV(alpha,n-2). The students performed poorly in large part because of their miscalculation of the sample size in number 18. The students double-counted the paired data, a common error.
In question 24 the students were given a formula to calculate the t-statistic based on the correlation r and the sample size. This was new material. The students knew how to calculate the correlation r, although their success rate was a tad low at 66%. The most common error was using the value of r-squared. Graphs still display r-squared rather than r.
Questions 25 to 28 were conceptually introduced during the course, with the result based on the new calculations in 23 and 24. The intent here was to see whether the students could go beyond the material specifically covered in the course and reach a statistical conclusion. Note that the miscalculation of t-critical does not affect the decisions in questions 25 through 28, the t-statistic is smaller than t-critical for both the correct n and the incorrect n. Half or more of the students not only showed mastery of basic statistical calculations, they also demonstrated an ability to take that knowledge into new statistical terrain and apply the principles of statistics. This suggests that for those students the knowledge is not short term memorized information that will be lost at term's end, but a deeper understanding of statistics.
Over the long haul, regression to the mean is as inescapable in statistics as entropy is in physics. Means return to long term means and those long term means return to even longer term means. And in the world of final examination averages, moving those longer term means is very difficult. Term-on-term fluctuations are almost meaningless and should not be viewed as calls to action. Since 2012 the final examination percent has moved in a narrow range of plus or minus four percent from 74%. Fall 2017 was slightly up at 79.3%, but this should not be taken as denoting a significantly improvement that will be retained over the long term. Just as there was a multi-term slump in the averages from Fall 2009 to Fall 2011, so can there be multi-term improvements that do not hold over the longer haul. That the changes made in the curriculum in the Fall of 2016 do not appear to have had a negative impact on final examination performance is encouraging.

The course average since 2007 has also remained stable and has tended to remain within four percent of 78%. As predicted in the Spring of 2017, the course average returned in the direction of the long term mean. This term's 76.2% course average may have no more meaning that a randomly varying value returning to the mean. Spring term's improvement to 83.8% can now be seen as a random variation in a stable statistic.

Suzanne presents her statistical analysis to the class
Three course level student learning outcomes currently guide MS 150 Introduction to Statistics:
- Perform basic statistical calculations for a single variable up to and including graphical analysis, confidence intervals, hypothesis testing against an expected value, and testing two samples for a difference of means.
- Perform basic statistical calculations for paired correlated variables.
- Engage in data exploration and analysis using appropriate statistical techniques including numeric calculations, graphical approaches, and tests.
Although some faculty opt to measure these during the term, my own work on the loss of mathematical knowledge among beginning of the term physical science students suggests that in term measurement of learning could generate inflated success rates. With the end of the term in statistics, the students in the spring 2017 run of the statistics course have not had course material for five weeks and two major spring holiday sequences prior to the final examination. During this five weeks the students have been analyzing data and preparing presentations on that data. There has been sufficient time for specific learning outcomes knowledge to be lost. Thus an item analysis of the final examination may provide some insight into retained learning.
Forty-two students sat the final examination. The table depicts the percent success rate on each item on the final examination.
The first twenty-two questions are course material. Questions 23 and 24 are material not covered in the course, questions 25 to 28 were conceptually covered but were based on the results of 23 and 24.
On core course material, the students performed exceptionally well. Only the calculation of the margin of error and the sample size for paired data underperformed.
Question 23 presented the students with a formula to calculate t-critical for paired data, TINV(alpha,n-2). The students performed poorly in large part because of their miscalculation of the sample size in number 18. The students double-counted the paired data, a common error.
In question 24 the students were given a formula to calculate the t-statistic based on the correlation r and the sample size. This was new material. The students knew how to calculate the correlation r, although their success rate was a tad low at 66%. The most common error was using the value of r-squared. Graphs still display r-squared rather than r.
Questions 25 to 28 were conceptually introduced during the course, with the result based on the new calculations in 23 and 24. The intent here was to see whether the students could go beyond the material specifically covered in the course and reach a statistical conclusion. Note that the miscalculation of t-critical does not affect the decisions in questions 25 through 28, the t-statistic is smaller than t-critical for both the correct n and the incorrect n. Half or more of the students not only showed mastery of basic statistical calculations, they also demonstrated an ability to take that knowledge into new statistical terrain and apply the principles of statistics. This suggests that for those students the knowledge is not short term memorized information that will be lost at term's end, but a deeper understanding of statistics.

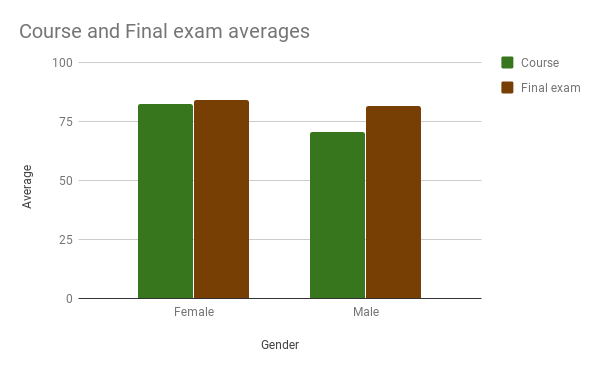
Chart with gender performance differences in the course and on the final
The female students had a higher course average than the male students, a difference that was significant. There was no significant gender difference in performance on the final examination.
The MS 150 Statistics course fall 2017 consisted of two sections, a total of 53 students, 26 female and 27 male. The two sections are kept in curricular synchronization during the term. Both sections covered the same material, worked the same assignments, and gave presentations on the same topics. The sections met at 8:00 and 9:00 on a Monday-Wednesday-Friday schedule.

The final examination in MS 150 Statistics has tracked performance data against the three course learning outcomes since the fall of 2012.

Final examination performance on the first course learning outcome, basic statistics, has been generally stable around 80% since fall 2012. Performance Spring 2017 rose to 84% and Fall 2017 performance improved again to 87%. Further below a longer view of performance argues that these will eventually fall back towards the long term average of 81%. The strong performance on basic statistics is still encouraging. This material was covered in August and September, two to three months ago.
While performance on paired data calculations had remained stable near 70%, this term saw a rise to 80%. The long term average remains 70% on this course learning outcome. Whether this represents a success in the strategy of shifting to open data exploration and presentations begun in the Fall of 2016 remains to be seen.
There is far more inertia in a value than I suspect those in education comprehend. There is a penchant in education for "continuous improvement." These success rates tend to be stable over long periods of time and reflect both the difficulty of the material as well as the many reasons students do not succeed on the material. For every student who did not do well, there is a complex back story.
The third subsection of the final examination cannot be compared on a term-on-term basis. The nature of the rubrics and scoring systems used to mark this section have changed over the terms.
Fall 2017 the average for the "above and beyond" material on the final examination (questions 23 to 28) was used as a proxy for the ability of the students to engage in open data exploration and analysis.


Performance by section on the final and in the course
Although the 8:00 section is usually impacted by transportation difficulties which have historically led to weaker performances by the 8:00 section versus the 9:00 section, there was no sectional differences on the final examination seen this term. There was no difference from past terms in absenteeism and late arrival to account for this parity: the 8:00 class had a higher rate of absenteeism and tardiness.
Course averages differed by section, consistent with the performance differential seen in prior terms. The students in the 8:00 section tend to have more absences and more frequently arrive late to class. There is also potentially a pre-selection factor. More organized students may register earlier and preferentially fill the later class - the 8:00 section is the last to fill during registration.
The final examination in MS 150 Statistics has tracked performance data against the three course learning outcomes since the fall of 2012.

Final examination performance by course learning outcome
While performance on paired data calculations had remained stable near 70%, this term saw a rise to 80%. The long term average remains 70% on this course learning outcome. Whether this represents a success in the strategy of shifting to open data exploration and presentations begun in the Fall of 2016 remains to be seen.
There is far more inertia in a value than I suspect those in education comprehend. There is a penchant in education for "continuous improvement." These success rates tend to be stable over long periods of time and reflect both the difficulty of the material as well as the many reasons students do not succeed on the material. For every student who did not do well, there is a complex back story.
The third subsection of the final examination cannot be compared on a term-on-term basis. The nature of the rubrics and scoring systems used to mark this section have changed over the terms.
Fall 2017 the average for the "above and beyond" material on the final examination (questions 23 to 28) was used as a proxy for the ability of the students to engage in open data exploration and analysis.

Long term trend in final examination average Fall 2005 - Fall 2017:
y-axis does not start at zero nor end at 100! vertical range is exaggerated!
y-axis does not start at zero nor end at 100! vertical range is exaggerated!
Over the long haul, regression to the mean is as inescapable in statistics as entropy is in physics. Means return to long term means and those long term means return to even longer term means. And in the world of final examination averages, moving those longer term means is very difficult. Term-on-term fluctuations are almost meaningless and should not be viewed as calls to action. Since 2012 the final examination percent has moved in a narrow range of plus or minus four percent from 74%. Fall 2017 was slightly up at 79.3%, but this should not be taken as denoting a significantly improvement that will be retained over the long term. Just as there was a multi-term slump in the averages from Fall 2009 to Fall 2011, so can there be multi-term improvements that do not hold over the longer haul. That the changes made in the curriculum in the Fall of 2016 do not appear to have had a negative impact on final examination performance is encouraging.

Long term course average and standard deviation
The course average since 2007 has also remained stable and has tended to remain within four percent of 78%. As predicted in the Spring of 2017, the course average returned in the direction of the long term mean. This term's 76.2% course average may have no more meaning that a randomly varying value returning to the mean. Spring term's improvement to 83.8% can now be seen as a random variation in a stable statistic.
The standard deviation of the students' individual course averages is also relatively stable around 15%. The amount of internal variation in student scores is fairly consistent term-on-term.
Overall, given a list of numbers and spreadsheet software, students show a strong mastery of basic statistics, good capabilities with linear regressions, and more moderate abilities with confidence intervals and basic hypothesis testing. The presentations may be providing a boost in the ability of the students to use the statistics that they have learned.
Overall, given a list of numbers and spreadsheet software, students show a strong mastery of basic statistics, good capabilities with linear regressions, and more moderate abilities with confidence intervals and basic hypothesis testing. The presentations may be providing a boost in the ability of the students to use the statistics that they have learned.
Comments
Post a Comment