Assessing general education science program learning outcome 3.5
General education science program learning outcome 3.5 states that students will be able to:


The overall average successful completion rate for the assigned laboratory reports was 84%. There is no pre-existing baseline data to use for comparison. As a single value that might provide some context, the average laboratory submission rate in SC 130 Physical Science at the national campus from 2014 to 2017 was 81%. An 84% submission rate systemwide is on par with that value.

Completion rates also showed a bimodal distribution. Were the higher completion rates seen for sections with fewer assigned laboratory reports? Yes, the highest completion rates belonged to the sections with the fewest laboratory reports.

There was a negative correlation between completion rates and the number of laboratory reports assigned. The rate of fall is -3.1% per additional lab report.The trendline suggests, however, that the section with a 62% completion rate for eight reports is underperforming in terms of projected completion rates, while the 81% completion rate for twelve reports is performing above projected completion rates. These averages, however, hide the complexity of the underlying data.

Submission rates fall during the term, and this occurs every term in that particular course. Submission rates fall at roughly -1.6% per lab in that section. Thus completion rates within a section fall at half the rate of the fall seen between sections with differing numbers of laboratory reports.

In general, submission rates fall. The complexity of the data argues against the existence of a single, simple way to raise completion rates for laboratory reports.
Each science with laboratory is unique and different. The number of reports which is appropriate will differ from course to course, section to section, and from site to site. Ultimately instructors have to determine how to best deliver their subject area and achieve the learning outcomes.
The rates of successfully completed laboratory reports and the number of reports completed by a student provide evidence that students have performed experiments that use scientific methods as part of the inquiry process.
Perform experiments that use scientific methods as part of the inquiry process.
This outcome serves institutional learning outcome eight quantitative reasoning where students will demonstrate the:
Ability to reason and solve quantitative problems from a wide array of authentic contexts and everyday life situations; comprehends and can create sophisticated arguments supported by quantitative evidence and can clearly communicate those arguments in a variety of formats.
Taken together, the assessment for program learning outcome 3.5 ought to provide evidence of an ability to create data supported documents that communicate results of experiments performed using scientific methods. In science classes with a laboratory component, laboratory reports provide documentation of students engaging in gathering data, analyzing data, and discussing results. The laboratory reports may also include tables of data and graphical elements such as charts, thereby also serving institutional learning outcome two effective written communication where students will demonstrate the:
Development and expression of ideas in writing through work in many genres and styles, utilizing different writing technologies, and mixing texts, data, and images through iterative experiences across the curriculum.
Instructors of science laboratory courses were asked to provide the following information:
- Which of your courses, if any, have students performing experiments that use scientific methods as part of the inquiry process?
- How is this documented in the course?
- If the documentation consists of laboratory reports, how many reports are assigned during a term?
- How many students are in the course?
- What is the completion rate for laboratory reports in the course?
The instructors were given the following additional guidance, "In this completion rate I would not include reports submitted that did not meet a minimum standard as set by you in your course.
As to what constitutes a laboratory report, my own definition would be a stand-alone document with an introduction, body, and conclusion."
Data was reported from eight sections of three courses at four campuses. Note that one course reported aggregate data for two sections. Without the ability to disaggregate the results, the course was reported as a single section of 36 students unless otherwise noted.

Average number of reports by courses at four campuses. SC 117 Tropical Pacific Island Environment, SC 120 Biology, SC 130 Physical Science
The overall average number of reports was 6.375 laboratory reports. No course is actually found at this average value. Courses are split above and below this value.

Number of sections with the number of reports shown on the x-axis.
The chart illustrates the "empty" mean: the distribution is effectively trimodal with a large spread.

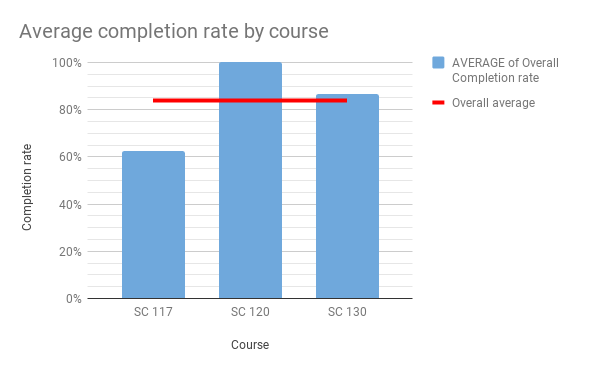
Average completion rate by course
The overall average successful completion rate for the assigned laboratory reports was 84%. There is no pre-existing baseline data to use for comparison. As a single value that might provide some context, the average laboratory submission rate in SC 130 Physical Science at the national campus from 2014 to 2017 was 81%. An 84% submission rate systemwide is on par with that value.

Histogram of average completion rate for eight sections

Number of laboratory reports versus completion rate
There was a negative correlation between completion rates and the number of laboratory reports assigned. The rate of fall is -3.1% per additional lab report.The trendline suggests, however, that the section with a 62% completion rate for eight reports is underperforming in terms of projected completion rates, while the 81% completion rate for twelve reports is performing above projected completion rates. These averages, however, hide the complexity of the underlying data.

Multi-term average turn-in rate by laboratory number for the section with 12 laboratories at an 81% overall completion rate
Submission rates fall during the term, and this occurs every term in that particular course. Submission rates fall at roughly -1.6% per lab in that section. Thus completion rates within a section fall at half the rate of the fall seen between sections with differing numbers of laboratory reports.

Completion rates for individual laboratories across multiple terms
In general, submission rates fall. The complexity of the data argues against the existence of a single, simple way to raise completion rates for laboratory reports.
Each science with laboratory is unique and different. The number of reports which is appropriate will differ from course to course, section to section, and from site to site. Ultimately instructors have to determine how to best deliver their subject area and achieve the learning outcomes.
The rates of successfully completed laboratory reports and the number of reports completed by a student provide evidence that students have performed experiments that use scientific methods as part of the inquiry process.


Comments
Post a Comment