Cooling curves
Week six in physical science began with a series of videos on heat and temperature on Monday. Wednesday focused on a demonstration of various temperatures from 0°C to 100°C. Noting that Desmos will regress against any arbitrary function with an arbitrary number of coefficients, I realized that the class could run a cooling curve experiment.
I provided no scaffolding for the 8:00 class other than to ask how the temperature might change with the passing of time for a cooling cup of water.

The groups worked with covered cups of boiling hot water. The cover was to reduce to convection as the equation for Newton's law of cooling does not strictly apply to convection.

The groups found that the decrease in temperature was slow, very slow.


Redsea and Jvida started off with their cup covered, but became dismayed at the slow rate of change. They later chose to remove the cover.

Their data is the purple line on the graph: a linear decrease in temperature. While other groups obtained arguably exponential decay cooling curves, Redsea and Jvida obtained a linear decay. During class discussion the pair noted that they had opted to remove the cover and that perhaps this had led to the linear result. The 8:00 lab section suggested that the 11:00 lab section try both covered and uncovered cups. This provided an excellent opportunity to note the importance of replication in science - even though the reality is that replication is all too rare in some fields. The 8:00 section also made some recommendations on timing, suggesting that after ten minutes the rate of recording could be reduced.

Students worked in pairs of pairs. Each pair would have one cup, one person reading the thermometer, the other reading the data. Each pair with a covered cup was paired with a pair with an uncovered cup.

Due to the class not being a multiple of four, one pair was unmatched.

The 11:00 class was shown the 8:00 data in Desmos using the new 50 inch display in A101 and a ChromeBook.
The 11:00 class produced the following data for the three pairs of pairs.

All of the groups obtained data that suggested exponential decay. Note that the most linear of the data, the upper purple data set, was for a covered cup, not an uncovered cup. The 11:00 findings did not support a theory that convective cooling might be linear. On the contrary, all cooling appeared to be modeled by an exponential decay model. This does not mean Redsea and Jvida were incorrect, something happened in their rig that led to a linear fall in temperature.
The curves were modeled in Desmos where y₁ is the temperature at time x₁ in minutes.
y₁~(T₀ - T₁)e^(kx₁)+T₁
In theory, T₀ is the starting temperature, 100°C, and T₁ is room temperature which was around 25°C. Rather than specify these values, Desmos was permitted to produce these values from the data.

One of the results was that while convective cooling may not strictly obey Newton's law of cooling, over the range of temperatures and conditions in this laboratory the convective cooling is sufficiently close to an exponential decay. The more rapid decay to room temperature is actually a benefit for demonstrating the curved nature of the relationship. The covered cups were well insulated and tended to appear to stop cooling down between 40°C and 60° Celsius. In the future use uncovered cups. Covered the result can look linear even after an hour of cooling!
Desmos has greatly expanded the mathematical range that the course and students can engage with. The power and flexibility of Desmos' regression capabilities are simply amazing.
I provided no scaffolding for the 8:00 class other than to ask how the temperature might change with the passing of time for a cooling cup of water.

Trevalouva and Jayleen
The groups worked with covered cups of boiling hot water. The cover was to reduce to convection as the equation for Newton's law of cooling does not strictly apply to convection.

John and Rufus
The groups found that the decrease in temperature was slow, very slow.

Rufus, Mike, John, Elisa, VanDamme, Yostrick

Redsea and Jvida
Redsea and Jvida started off with their cup covered, but became dismayed at the slow rate of change. They later chose to remove the cover.

Their data is the purple line on the graph: a linear decrease in temperature. While other groups obtained arguably exponential decay cooling curves, Redsea and Jvida obtained a linear decay. During class discussion the pair noted that they had opted to remove the cover and that perhaps this had led to the linear result. The 8:00 lab section suggested that the 11:00 lab section try both covered and uncovered cups. This provided an excellent opportunity to note the importance of replication in science - even though the reality is that replication is all too rare in some fields. The 8:00 section also made some recommendations on timing, suggesting that after ten minutes the rate of recording could be reduced.

Sunet, Dee-L, and Melsina
Students worked in pairs of pairs. Each pair would have one cup, one person reading the thermometer, the other reading the data. Each pair with a covered cup was paired with a pair with an uncovered cup.

Kaiteie, Darion, Justice, Saichy, Johsper
Due to the class not being a multiple of four, one pair was unmatched.

AJ, Tulpe, Amy-Lang

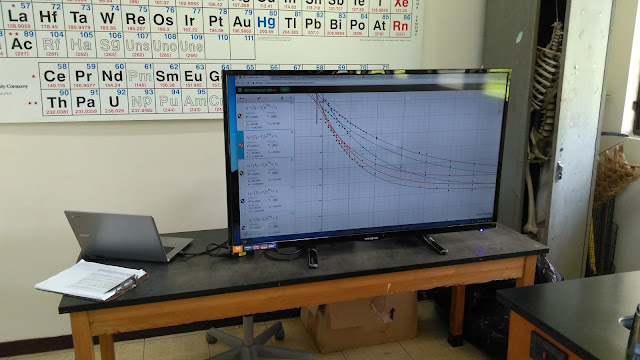
11:00 data on screen at end of class
The 11:00 class was shown the 8:00 data in Desmos using the new 50 inch display in A101 and a ChromeBook.
The 11:00 class produced the following data for the three pairs of pairs.

All of the groups obtained data that suggested exponential decay. Note that the most linear of the data, the upper purple data set, was for a covered cup, not an uncovered cup. The 11:00 findings did not support a theory that convective cooling might be linear. On the contrary, all cooling appeared to be modeled by an exponential decay model. This does not mean Redsea and Jvida were incorrect, something happened in their rig that led to a linear fall in temperature.
The curves were modeled in Desmos where y₁ is the temperature at time x₁ in minutes.
y₁~(T₀ - T₁)e^(kx₁)+T₁
In theory, T₀ is the starting temperature, 100°C, and T₁ is room temperature which was around 25°C. Rather than specify these values, Desmos was permitted to produce these values from the data.

One of the results was that while convective cooling may not strictly obey Newton's law of cooling, over the range of temperatures and conditions in this laboratory the convective cooling is sufficiently close to an exponential decay. The more rapid decay to room temperature is actually a benefit for demonstrating the curved nature of the relationship. The covered cups were well insulated and tended to appear to stop cooling down between 40°C and 60° Celsius. In the future use uncovered cups. Covered the result can look linear even after an hour of cooling!
Desmos has greatly expanded the mathematical range that the course and students can engage with. The power and flexibility of Desmos' regression capabilities are simply amazing.


Comments
Post a Comment