Accelerated motion: three days of acceleration
On Monday I accelerated a RipStik from 0 cm/s across a 1200 centimeters of fairly flat sidewalk. To permit concentration on a steady acceleration I had three timers timing the runs with timing marks at 100, 200, 300, 400, 600, 800, 1000, and 1200 centimeters. A couple runs were made.

Two of the timers generated time versus distance data that appeared to be linear. A third timer produced data that was best fit by d = ½ 80 t1.71226. The Desmos graph above shows the fit to d =½ at² where a was 51 cm/s².

The result is not that satisfying from the perspective of arguing that acceleration is a quadratic relationship. In previous terms where I have done the timing shapes closer to parabolas have resulted.
This shifted the Wednesday plan to an introduction of d = ½ at² + v₀t + d₀ with explanations of the variables. A brief comparison to y = ax² + bx + c, the nature of c as the y-intercept and 2ax+b as the slope. That the slope is zero at the vertex leads to the x= -b/2a formula was mentioned. Then a return to d = ½ at² + v₀t + d₀ and the idea of coming across d₀ = 0 with a speed v₀ generating a y = ax² + bx graph, but with a negative a. The concept will be approached graphically. Desmos will let us fit the data to an arbitrary function including d = ½at² + vt.

Runs were made uphill into the LRC. The posts were used for timing marks, with one student assigned to track the vertex location. Timing included a vertex time. Regressions were run in Desmos.

This yielded the sought after parabola. Data was shared and the above was assigned as a homework. The acceleration came in around -40 centimeters per second squared with an initial inbound velocity of 288 cm/s.
This provided a stronger foundation for the acceleration of gravity laboratory on Thursday.

Desmos also permits another way to run raw and percentage error calculations. Once the regression is run, then the letter g has an assigned value and can be used in subsequent formulas.
The return to the sidewalk on Wednesday was fun and perhaps interesting. I think there was more benefit for some students than lecturing on the board on the Monday run. Still, the Wednesday run is hard to understand. The negative acceleration is puzzling for students: back towards the starting line.

The laboratory on Thursday went, if anything, more smoothly than in the past. Perhaps acceleration was sinking in as a concept.


Two of the timers generated time versus distance data that appeared to be linear. A third timer produced data that was best fit by d = ½ 80 t1.71226. The Desmos graph above shows the fit to d =½ at² where a was 51 cm/s².

The result is not that satisfying from the perspective of arguing that acceleration is a quadratic relationship. In previous terms where I have done the timing shapes closer to parabolas have resulted.
This shifted the Wednesday plan to an introduction of d = ½ at² + v₀t + d₀ with explanations of the variables. A brief comparison to y = ax² + bx + c, the nature of c as the y-intercept and 2ax+b as the slope. That the slope is zero at the vertex leads to the x= -b/2a formula was mentioned. Then a return to d = ½ at² + v₀t + d₀ and the idea of coming across d₀ = 0 with a speed v₀ generating a y = ax² + bx graph, but with a negative a. The concept will be approached graphically. Desmos will let us fit the data to an arbitrary function including d = ½at² + vt.

Runs were made uphill into the LRC. The posts were used for timing marks, with one student assigned to track the vertex location. Timing included a vertex time. Regressions were run in Desmos.

This yielded the sought after parabola. Data was shared and the above was assigned as a homework. The acceleration came in around -40 centimeters per second squared with an initial inbound velocity of 288 cm/s.
This provided a stronger foundation for the acceleration of gravity laboratory on Thursday.

Desmos also permits another way to run raw and percentage error calculations. Once the regression is run, then the letter g has an assigned value and can be used in subsequent formulas.
The return to the sidewalk on Wednesday was fun and perhaps interesting. I think there was more benefit for some students than lecturing on the board on the Monday run. Still, the Wednesday run is hard to understand. The negative acceleration is puzzling for students: back towards the starting line.
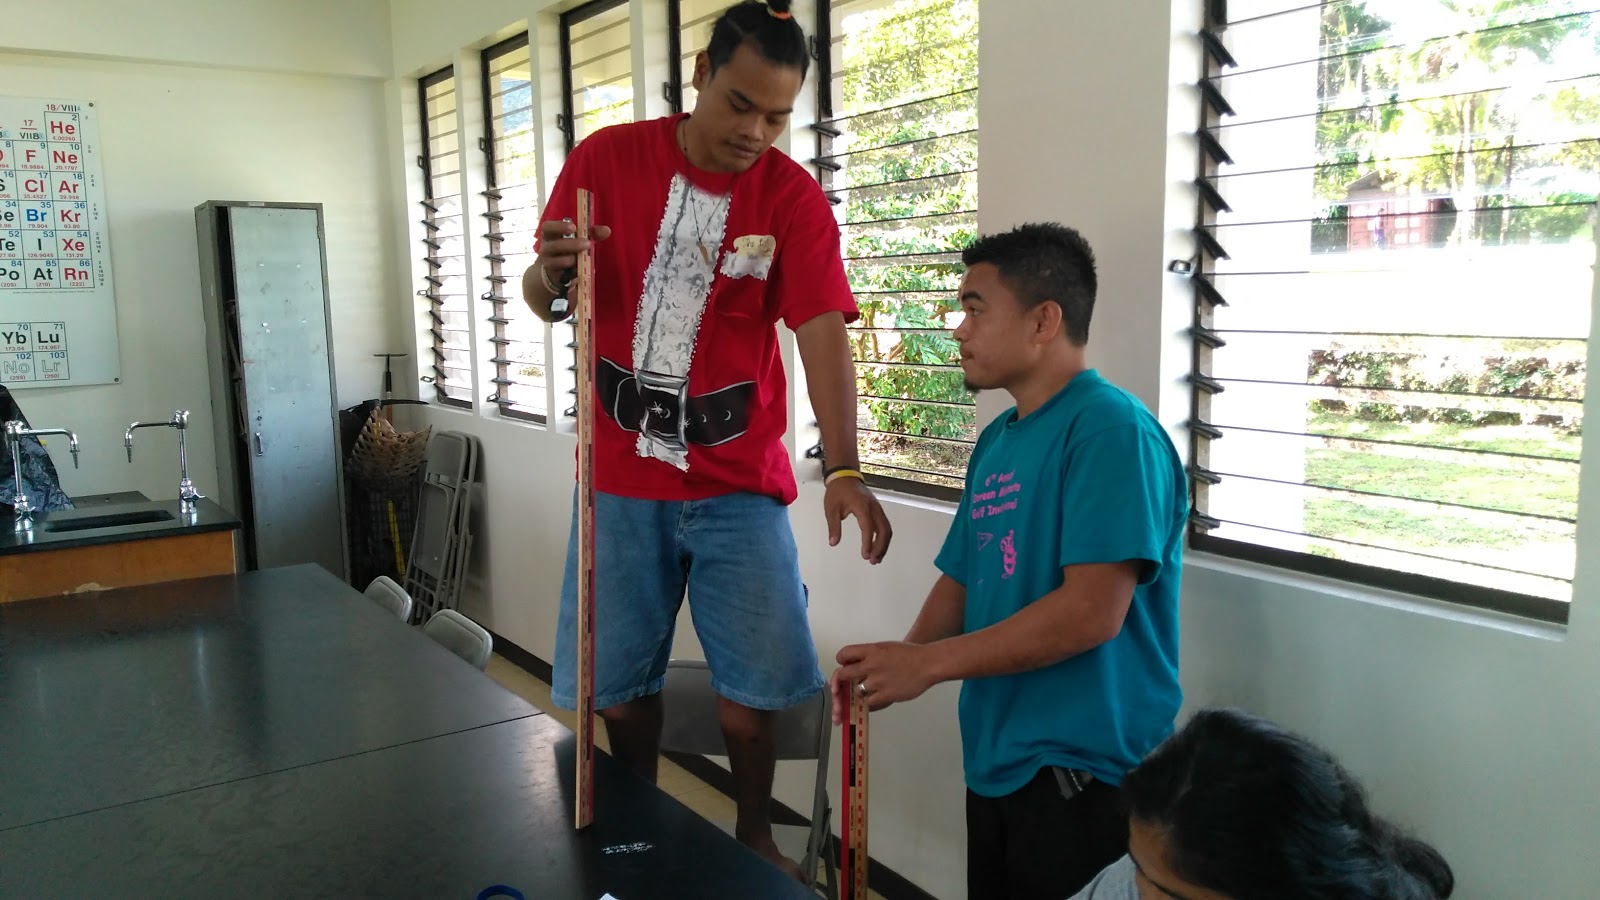
Yostrick and John Phillip Jr.
The laboratory on Thursday went, if anything, more smoothly than in the past. Perhaps acceleration was sinking in as a concept.

Rufus, Ardy, and Elisa

Jayleen Alex, Redsea, and Myreen

Jayleen and Redsea discuss results from Desmos

Mayleen Araisang, Dee-L, and Melsina

Johsper, Any-Lang, and Saichy

Melsina

Melsina taking notes the modern way


Comments
Post a Comment