Linear velocity
Monday in physical science I laid out a 3000 centimeter flat stretch marked off every 300 cm to generate a time versus distance graph for my RipStik.

The result was a nicely linear run at 206 cm/s.
Wednesday I went over the homework, sharing a spreadsheet with the instantaneous velocities. I also used the rear screen to cover using the monkey wrench in Desmos to adjust the axes so that the graph did not wind up looking like a vertical line on the y-axis.

On Thursday I noted that the class was essentially repeating the exercise of Monday, only now there was a specific focus on how slope relates to speed.

The procedure is the more recently used timed crossing of chalk marks on the sidewalk.

The slow run was done at intervals of 100 cm out to 600 cm.


New "heavy duty" chalk from Ace Office Supply provided large, vivid lines. The class went through four pieces today, the chalk went faster than even I expected. There are some 12 more in the box.

The second run was done at a medium speed over 200 cm intervals out to 1000 cm.

The third and fastest run was done every 500 cm out to 2000 cm. Elymore proved accurate and capable at this speed and range, running one ball right down the middle. 2000 cm was near the entrance to the south faculty building.

Once we went upstairs, the loss of velocity especially in the medium fast and fastest runs was apparent. The fastest run in the chart above is clearly non-linear with a decreasing slope, as is the medium fast run. Only the slow run appeared to be fairly linear. The ball speeds were 178 cm/s, 322 cm/s, and 453 cm/s.
At 11:00 I decided to do an experiment within an experiment. I would ride the RipStik to produce three speeds.


Fast runs were timed at 500 cm intervals and necessitated my bailing and running out after the 2000 cm mark. My landing speed was just above my running pace. Good shoes brought in this summer by my son helped me make the landings.


Oddly enough, in contrast to the slow ball being the only linear run, for the RipStik the slow run was the only run that was not almost perfectly linear. The slow run showed signs of slowing during the run. The RipStik had a slow speed of 115 cm/s, with another run (not shown) at 111 cm/s. The medium speed run was 187 cm/s with a fast run at 327 cm/s, well above my usual running speed.
The two approaches have their pluses and minuses. The RipStik never veers off course into a post. Every RipStik run is right up the middle for the full distance. The ball will always slow down, there is no propulsion after the initial pitch. The RipStik may actually speed up and down during a run, the ball will consistently slow. Ball speeds start higher and end higher than the speeds the RipStik can achieve, the RipStik can go slower than the ball while remaining on the center line. Hard to say which, if either, is better. Certainly the ball is "safer" for the instructor, although two students demonstrated an ability to ride the RipStik.
Currently this laboratory is functioning in a predictable, expected, and even optimal manner, well demonstrating the link between speed and slope. Desmos provides a simple and direct way to chart all three lines on a single graph, something that used to require unusual table layouts in a spreadsheet. And Desmos makes running a linear regression with an intercept of zero easier than running a regression with an intercept. The forcing of zero is natural in Desmos. What might be fun would be a larger ball such as an exercise ball or perhaps a heavier, harder ball such as a bowling ball.

The result was a nicely linear run at 206 cm/s.
Wednesday I went over the homework, sharing a spreadsheet with the instantaneous velocities. I also used the rear screen to cover using the monkey wrench in Desmos to adjust the axes so that the graph did not wind up looking like a vertical line on the y-axis.

Elymore bowls in the 8:00 section
On Thursday I noted that the class was essentially repeating the exercise of Monday, only now there was a specific focus on how slope relates to speed.

Myreen was the catcher
The procedure is the more recently used timed crossing of chalk marks on the sidewalk.

John Phillip Jr, Yostrick, Ardy Keoki, and Rufus timing a run. Myreen catching. Mike Selestine far left was recording data.
The slow run was done at intervals of 100 cm out to 600 cm.

The president joined the class briefly

President Daisy, Elymore. Mike and John consult on times on the right.

New "heavy duty" chalk from Ace Office Supply provided large, vivid lines. The class went through four pieces today, the chalk went faster than even I expected. There are some 12 more in the box.

The second run was done at a medium speed over 200 cm intervals out to 1000 cm.


Once we went upstairs, the loss of velocity especially in the medium fast and fastest runs was apparent. The fastest run in the chart above is clearly non-linear with a decreasing slope, as is the medium fast run. Only the slow run appeared to be fairly linear. The ball speeds were 178 cm/s, 322 cm/s, and 453 cm/s.
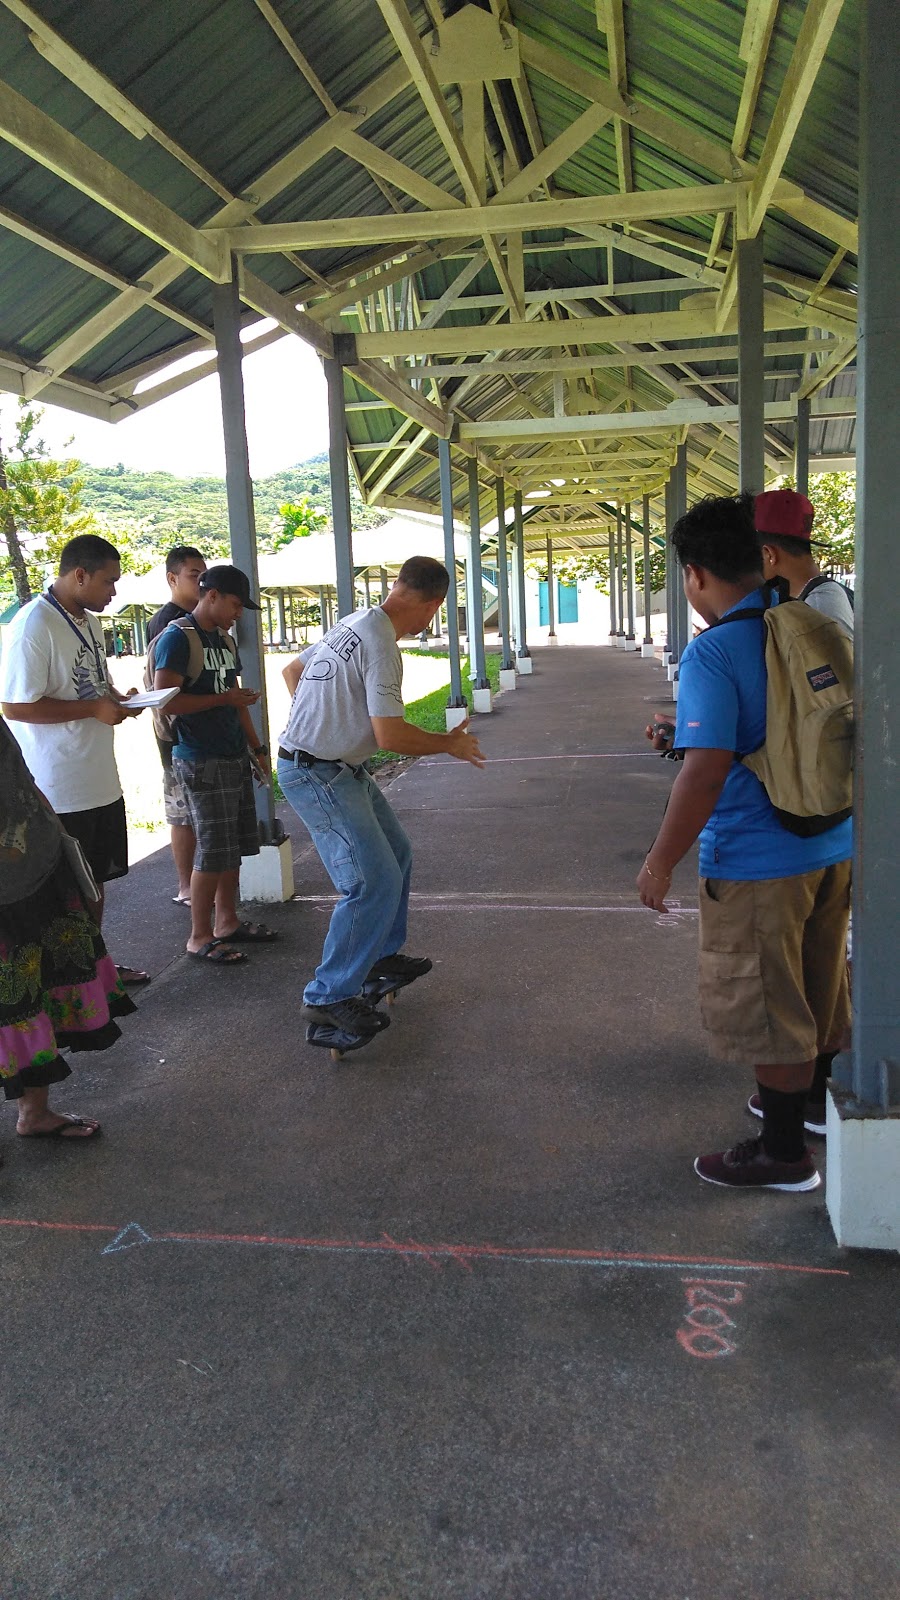
At 11:00 I decided to do an experiment within an experiment. I would ride the RipStik to produce three speeds.

Here was a practice timing pass with the 100 cm distance mark being called out


This was a fastest run timed at 500 cm intervals out to 2000 cm.
Fast runs were timed at 500 cm intervals and necessitated my bailing and running out after the 2000 cm mark. My landing speed was just above my running pace. Good shoes brought in this summer by my son helped me make the landings.

Another of the fast runs out to 2000 cm

Moving as flat out fast as I can is perhaps not recommended in my age group.

But riding fast is so much fun.

RipStik time versus distance velocity data
The two approaches have their pluses and minuses. The RipStik never veers off course into a post. Every RipStik run is right up the middle for the full distance. The ball will always slow down, there is no propulsion after the initial pitch. The RipStik may actually speed up and down during a run, the ball will consistently slow. Ball speeds start higher and end higher than the speeds the RipStik can achieve, the RipStik can go slower than the ball while remaining on the center line. Hard to say which, if either, is better. Certainly the ball is "safer" for the instructor, although two students demonstrated an ability to ride the RipStik.
Currently this laboratory is functioning in a predictable, expected, and even optimal manner, well demonstrating the link between speed and slope. Desmos provides a simple and direct way to chart all three lines on a single graph, something that used to require unusual table layouts in a spreadsheet. And Desmos makes running a linear regression with an intercept of zero easier than running a regression with an intercept. The forcing of zero is natural in Desmos. What might be fun would be a larger ball such as an exercise ball or perhaps a heavier, harder ball such as a bowling ball.


Comments
Post a Comment