A visit to the weather station, RipStik wave, sound speed, and the colors of the spectrum
The physical science class arrived at the National Weather Service office at 9:47 A.M. Only two students opted to ride the bus down from campus.

The class arrived in time for the 10:00 weather balloon launch. Stephanie, Lillibeth, and Herlinda look on as the balloon is prepared for filling with hydrogen.

The team at the weather station explains the purpose of the weather balloon.

The radiosonde will report back temperature, pressure, and dew point data.

Balloon away!

Balloon aloft on a day of scattered clouds.

Inside the data from the balloon is being tracked.

Raw data as the balloon ascends.

Current station pressure.

The class listens intently as the weather balloon data is explained.

METAR report data.

Satellite shots over the Pacific.

"Chatty beetles" for communications with the outer islands.
On Wednesday morning attention turned to waves, led off by the recording of a RipStik wave

A wavelength of 80 cm and an amplitude of 7 cm was obtained.

1.92 seconds was the duration to lay down 4.75 waves on the paper.

Both the space equation of f(x)=7 sin(2𝜋x÷80) and the time equation of f(t)=sin(2𝜋(2.47)t) were written out with the note that this system has two equations that describe the system, one in space and the other in time.


Jennifer Peter Serrano takes notes with her camera.

The laboratory on Wednesday sought to measure the speed of sound. The clappers were slightly east of the location used spring term. The clappers stood at the coral spur that provides access to the A building generator, roughly two trees east of the spring location.

Out at 500 meters the sound is always fainter, but this term the sound was particularly faint. Unknown to the timers was that one of the clappers had split clean in half lengthwise and the clapping team was coping with a fragment of wood.

Herlinda, Lillibeth at 500 meters.

Stephanie was the flagger that helped the clappers know when to clap. Arrayed behind her are Genrisa, Janet, Jennifer, Lillibeth, Shamrock, Ronda, and Mayleen.

The timing line: Lillibeth, Shamrock, Ronda, Mayleen, Iva Nicole, and Herlinda.

The class would eventually push out to 550 meters and pull in data that supported a sound speed of 346 m/s.

This was within 3 m/s of the 349 m/s based on the temperature that day, an estimated error of less than one percent.

Thursday morning I showed the Limits of Light video in A101. As the video played I wrote notes on the board.

At some point these notes should probably be converted to a guide.

In the afternoon I used the onlinehtmleditor to simplify displaying the colors from HTML. This worked much better than trying to help the students use Notepad.exe with its "Save as... all files" requirement, and the need to save and then refresh the page. The Online HTML Editor is interactive and live, also displays SVG.

The class arrived in time for the 10:00 weather balloon launch. Stephanie, Lillibeth, and Herlinda look on as the balloon is prepared for filling with hydrogen.

The team at the weather station explains the purpose of the weather balloon.

The radiosonde will report back temperature, pressure, and dew point data.

Balloon away!

Balloon aloft on a day of scattered clouds.

Inside the data from the balloon is being tracked.

Raw data as the balloon ascends.

Current station pressure.

The class listens intently as the weather balloon data is explained.

METAR report data.

Satellite shots over the Pacific.

"Chatty beetles" for communications with the outer islands.
On Wednesday morning attention turned to waves, led off by the recording of a RipStik wave

A wavelength of 80 cm and an amplitude of 7 cm was obtained.

1.92 seconds was the duration to lay down 4.75 waves on the paper.

Both the space equation of f(x)=7 sin(2𝜋x÷80) and the time equation of f(t)=sin(2𝜋(2.47)t) were written out with the note that this system has two equations that describe the system, one in space and the other in time.


Jennifer Peter Serrano takes notes with her camera.

The laboratory on Wednesday sought to measure the speed of sound. The clappers were slightly east of the location used spring term. The clappers stood at the coral spur that provides access to the A building generator, roughly two trees east of the spring location.

Out at 500 meters the sound is always fainter, but this term the sound was particularly faint. Unknown to the timers was that one of the clappers had split clean in half lengthwise and the clapping team was coping with a fragment of wood.

Herlinda, Lillibeth at 500 meters.

Stephanie was the flagger that helped the clappers know when to clap. Arrayed behind her are Genrisa, Janet, Jennifer, Lillibeth, Shamrock, Ronda, and Mayleen.

The timing line: Lillibeth, Shamrock, Ronda, Mayleen, Iva Nicole, and Herlinda.

The class would eventually push out to 550 meters and pull in data that supported a sound speed of 346 m/s.

This was within 3 m/s of the 349 m/s based on the temperature that day, an estimated error of less than one percent.
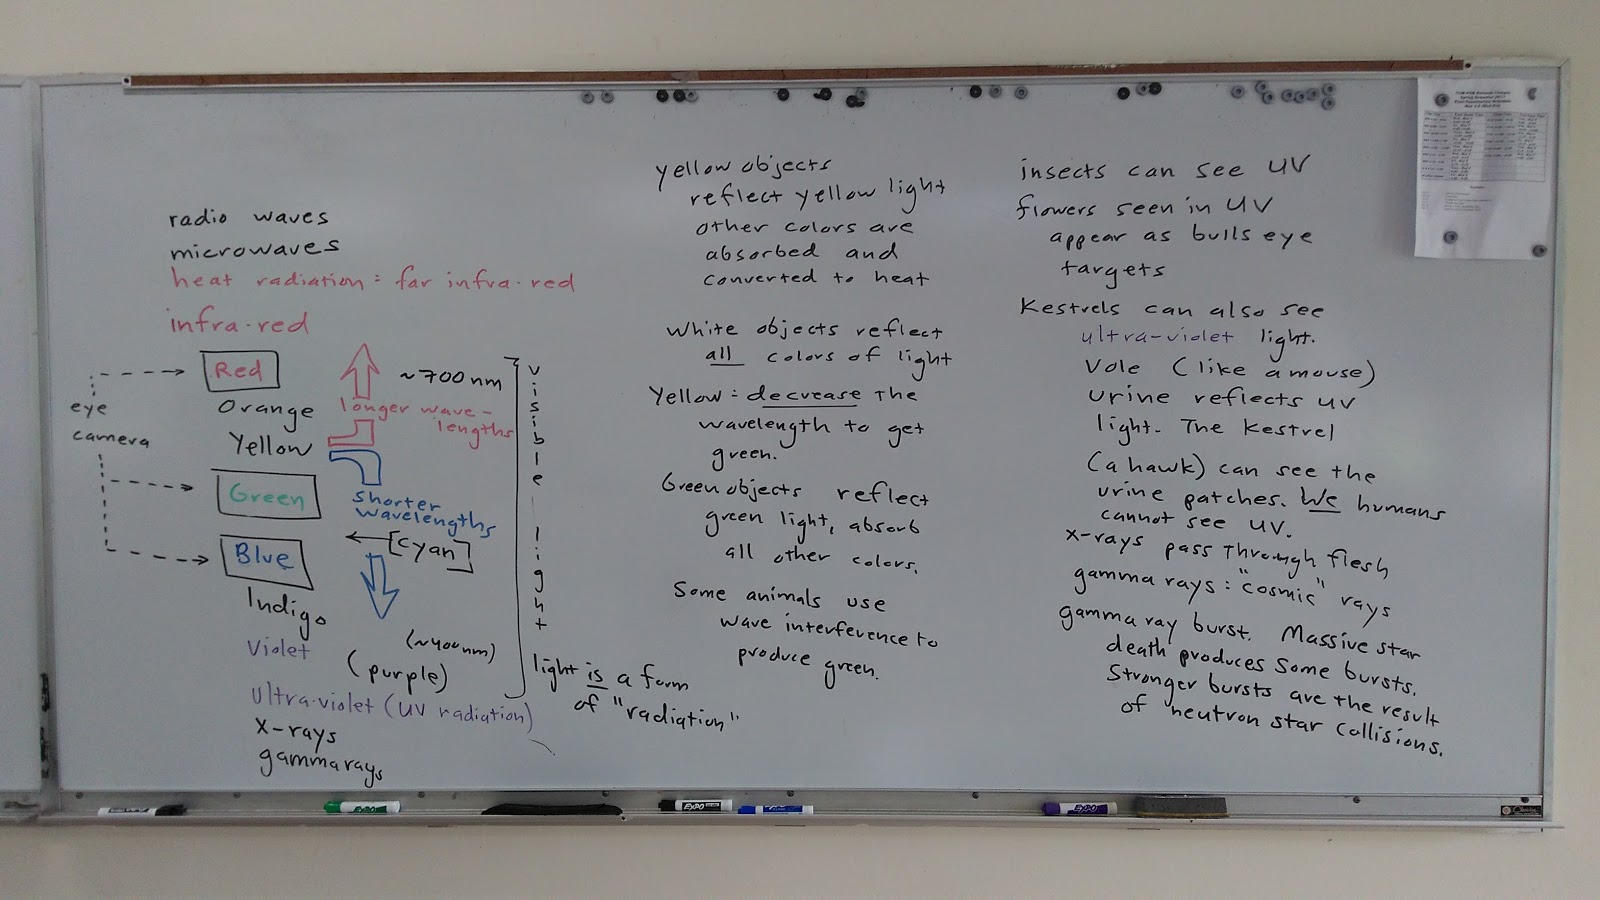
Thursday morning I showed the Limits of Light video in A101. As the video played I wrote notes on the board.

At some point these notes should probably be converted to a guide.

In the afternoon I used the onlinehtmleditor to simplify displaying the colors from HTML. This worked much better than trying to help the students use Notepad.exe with its "Save as... all files" requirement, and the need to save and then refresh the page. The Online HTML Editor is interactive and live, also displays SVG.


Comments
Post a Comment