Peanut Mars and Murrie Statistics
For fifteen years statistics started with gathering data on body metrics and then launching into a lecture driven course. In 2008 I added statistics projects to the lecture and test mix. The statistics projects did not result in increased student engagement with statistics. In 2013 the experiment with projects was replaced with exercises in open data exploration. In 2015 the open data explorations were capped off by a single student presentation. In subsequent terms the number of end of term presentations would be increased. The course was still structured around a lecture and test format in the first eleven to twelve weeks of the course, and three to four weeks of open data exploration. In an attempt to integrate a more problem based learning approach to learning in statistics, in fall 2016 the curriculum was altered to include open data exploration and presentations from start of the term.
As I approached fall term 2016 I realized, while out on a run, that I wanted to start the term by walking into class and saying, "Presentations are due on Friday. Any questions?" The data source for the presentation had to be something fun and the statistical aspect had to be accomplished on essentially zero knowledge. In the realm of statistics there is a widely known known statistical exploration exercise based on the work of Forrest Mars and Bruce Murrie seventy-five years ago.
Spring 2017 saw limited supplies of plain MMs on island and forced a switch to peanut MMs. With an alternate vendor charging $1.29 a bag, the MMs were obtained from Yoshie where they were a dollar a bag, with a discount on the 48 count case. The petty cash request preceded registration. As a result an estimate based on the fall term was used to request seventy-two dollars. By Friday morning 51 students were enrolled in the class. With registration continuing into Friday afternoon, a purchase was executed of 54 bags.

Day one attendance was problematic with 10 of 25 absent at 8:00 and 9 of 26 absent at 9:00. No 10:00 section was run this term. Add/drop saw the addition of only a couple students to the 8:00 section during Monday afternoon. They were given MMs and the weight of their bag.

I opened the 8:00 class with the "Presentations due Friday" gambit, and immediately a student asked what to present on. In the 9:00 class there was a long silence. I outwaited the long silence, an acquired skill. A student finally had the gumption to ask, "What are we presenting on?" And then I brought out the MMs and the question sheets.

In both classes I did outline some of the Internet issues the island is facing at this particular time, and I presented software options that they might use.

Wednesday was a working day. I attempted to show the Death by PowerPoint video at 8:00. The video made it about 75% of the way through the video when the bandwidth choked off due to the fiber optic cable undergoing repair. At 9:00 I could not start the video. Those who were partnered on Monday continued to work. Some partners had lost a partner due to course drop, those who had lost a partner opted to work alone.
One student on Monday had tried to pick an absent partner, I denied that request. The partner of choice showed up Wednesday, but so did other absentees along with course adds. These were paired up. I still had MMs and I had brought the scale, so those who started Wednesday were starting from the same materials as those who started Monday.
In one instance I added a add to a existing pair to form a trio.

On Wednesday afternoon three alumni of ethnobotany including one who had taken statistics previously added the class. I had the MMs and scale in my office. I asked if they wanted to work as a threesome, even though one student was in the 8:00 section and two in the 9:00. Although the 8:00 member would be absent Friday, the 9:00 team would go ahead and do a solid presentation on zero class hours including an excellent histogram chart.

Arriving early on Friday I downloaded the few submissions that came in via Schoology. I also had to download those submitted via email.

The wireless keyboard and mouse are not working in A204, so I also had to switch the keyboard and mouse to the back USB ports to permit students to run presentations off of flash drives. This did open up the opportunity to edit during class, I would have had to disrupt presentations to ask students not to tweak presentations during class. The temptation to fix a discovered error based on the presentations being shown is irresistible for anyone.

Given that I had not shown Death by PowerPoint, I could not mark the presentations for appropriate use of the software. And while a dark background works well in a low light conference room with a pin spot on the speaker, in a classroom on a SMART board the dark backgrounds pick up light reflections. Yes, the lights could be turned off. Bear in mind that with the need to access the USB ports on the computer in the cabinet below the screen, the lights would have had to go on and off.

Perhaps a new, shorter PowerPoint that covers the key ideas of slide design and brain function ought to be sought.
By Wednesday afternoon and the end of the add drop period there were only four bags of MMs left which meant that 50 of the 54 bags had been distributed. Although drops and adds technically increased the overall number of students beyond the original 51, the number purchased was not exceeded.
The presentations went well. The students cited, often without knowing the terms, concepts such as mode, average number per color, and generated nominal level histograms. They also showed an ability with the software and a willingness to cope with the sketchy Internet situation at present. This remains a strong way to start the term and sets the tone for the rest of the term. Beginnings are ever so important, and this starts the course off on solid footing.
As I approached fall term 2016 I realized, while out on a run, that I wanted to start the term by walking into class and saying, "Presentations are due on Friday. Any questions?" The data source for the presentation had to be something fun and the statistical aspect had to be accomplished on essentially zero knowledge. In the realm of statistics there is a widely known known statistical exploration exercise based on the work of Forrest Mars and Bruce Murrie seventy-five years ago.
Spring 2017 saw limited supplies of plain MMs on island and forced a switch to peanut MMs. With an alternate vendor charging $1.29 a bag, the MMs were obtained from Yoshie where they were a dollar a bag, with a discount on the 48 count case. The petty cash request preceded registration. As a result an estimate based on the fall term was used to request seventy-two dollars. By Friday morning 51 students were enrolled in the class. With registration continuing into Friday afternoon, a purchase was executed of 54 bags.

Day one attendance was problematic with 10 of 25 absent at 8:00 and 9 of 26 absent at 9:00. No 10:00 section was run this term. Add/drop saw the addition of only a couple students to the 8:00 section during Monday afternoon. They were given MMs and the weight of their bag.


In both classes I did outline some of the Internet issues the island is facing at this particular time, and I presented software options that they might use.

Wednesday was a working day. I attempted to show the Death by PowerPoint video at 8:00. The video made it about 75% of the way through the video when the bandwidth choked off due to the fiber optic cable undergoing repair. At 9:00 I could not start the video. Those who were partnered on Monday continued to work. Some partners had lost a partner due to course drop, those who had lost a partner opted to work alone.
One student on Monday had tried to pick an absent partner, I denied that request. The partner of choice showed up Wednesday, but so did other absentees along with course adds. These were paired up. I still had MMs and I had brought the scale, so those who started Wednesday were starting from the same materials as those who started Monday.
In one instance I added a add to a existing pair to form a trio.

Sweena, Shannon, and Rufus
On Wednesday afternoon three alumni of ethnobotany including one who had taken statistics previously added the class. I had the MMs and scale in my office. I asked if they wanted to work as a threesome, even though one student was in the 8:00 section and two in the 9:00. Although the 8:00 member would be absent Friday, the 9:00 team would go ahead and do a solid presentation on zero class hours including an excellent histogram chart.

Chart by Dannia
Arriving early on Friday I downloaded the few submissions that came in via Schoology. I also had to download those submitted via email.

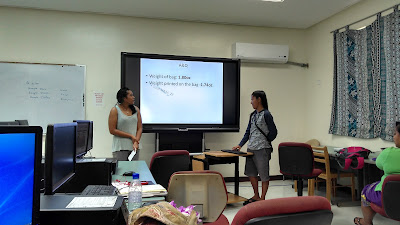
Sunet and Jaysleen
The wireless keyboard and mouse are not working in A204, so I also had to switch the keyboard and mouse to the back USB ports to permit students to run presentations off of flash drives. This did open up the opportunity to edit during class, I would have had to disrupt presentations to ask students not to tweak presentations during class. The temptation to fix a discovered error based on the presentations being shown is irresistible for anyone.

Given that I had not shown Death by PowerPoint, I could not mark the presentations for appropriate use of the software. And while a dark background works well in a low light conference room with a pin spot on the speaker, in a classroom on a SMART board the dark backgrounds pick up light reflections. Yes, the lights could be turned off. Bear in mind that with the need to access the USB ports on the computer in the cabinet below the screen, the lights would have had to go on and off.

Perhaps a new, shorter PowerPoint that covers the key ideas of slide design and brain function ought to be sought.

Leah and Regina
By Wednesday afternoon and the end of the add drop period there were only four bags of MMs left which meant that 50 of the 54 bags had been distributed. Although drops and adds technically increased the overall number of students beyond the original 51, the number purchased was not exceeded.
The presentations went well. The students cited, often without knowing the terms, concepts such as mode, average number per color, and generated nominal level histograms. They also showed an ability with the software and a willingness to cope with the sketchy Internet situation at present. This remains a strong way to start the term and sets the tone for the rest of the term. Beginnings are ever so important, and this starts the course off on solid footing.


Comments
Post a Comment