Guided data exploration and presentation
Given the time constraints and the goal of having the students statistically explore a linear relationship, the ball bounce "problem based learning" exercise was more of a guided data exploration exercise.

In the first part of the exploration, the students were tasked with determining the relationship between the drop height for a ball versus the height of the first bounce. In this portion of the exercise the ball was dropped from different heights.

In the second part of the exploration the students were asked to look for a relationship between the bounce number and the bounce height: the height of the first bounce, second bounce, third bounce, fourth bounce. In this exercise the ball was always dropped from 100 centimeters.

The result was a structured and guided exploration of a particular system, rather than an open exploration and problem solving orientation. These explore-analyze-present exercises are designed to run for a week, allowing for a mix of traditional statistical content presentation and student driven analysis and presentation.

The data was gathered on Monday, Wednesday was a working day, Friday was presentation day.

The exercise was guided and structured by the following instructions:
This open data exploration asks you to explore the relationships between drop heights and bounce heights for a superball. There are two explorations to be completed. The first asks you determine the relationship between drop heights and the height of the first bounce for different drop heights. The second asks you to determine the bounce height for each successive bounce when the superball is dropped from a height of 100 centimeters. For each exploration generate a table, an xy scattergraph, generate a trend line, report the equation for the trend line, and the correlation for the trend line.

First exploration
Drop the superball from at least ten different heights. Put the meter stick with the 0 cm at the bottom, 100 cm at the top. Record the height of the first bounce. Use this data to make a table of drop height in centimeters versus the bounce height in centimeters. Create an xy scattergraph, add a trend line, and then report the equation for the trend line including the slope, the intercept, the correlation and any other appropriate statistics. Would the equation predict the bounce for any drop height? What else can you tell the audience about the meaning of the slope?

Second exploration
Drop the superball from 100 centimeters high. Record the height of the first bounce. Drop the ball again from 100 cm, let the ball bounce once, and then record the height of the second bounce. Drop the ball again from 100 cm, let the ball bounce twice, and then record the height of the third bounce. Repeat drops from 100 cm until you cannot measure the bounce height any more.

Make a table of bounce number versus bounce height. Use this data to build a table, create an xy scattergraph. Can you add a trend line to the graph? What type of trend line appears to produce the best fit? For that trend line can you at least report the correlation? What does the best fit trend line suggest about bouncing - does the ball stop bouncing or do the bounces just get smaller and smaller until you cannot see them? Any idea what kind of equation might predict the bounce height for any bounce number?

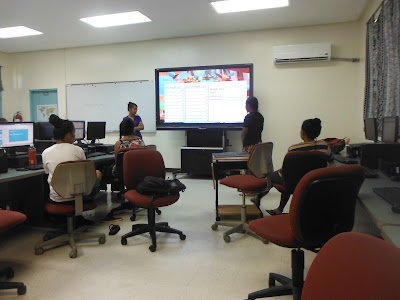
In the above diagram Mitchell Marino uses Google Slides to display a Google Sheets chart of the data from the first part of the exploration. To avoid a conversion issue that arises when using the import function from Google Slides to Schoology using the Google Drive add on, one student submitted the sharing link. This generates a submission in Schoology while providing access to the native Google Slides format presentation.

The students presented their findings to the class.
True problem based learning would embed statistical learning within a larger problem framework where the nature of the problem would drive students to learn the statistics necessary to analyze the system. That level of design still eludes me.


In the second part of the exploration the students were asked to look for a relationship between the bounce number and the bounce height: the height of the first bounce, second bounce, third bounce, fourth bounce. In this exercise the ball was always dropped from 100 centimeters.

The result was a structured and guided exploration of a particular system, rather than an open exploration and problem solving orientation. These explore-analyze-present exercises are designed to run for a week, allowing for a mix of traditional statistical content presentation and student driven analysis and presentation.

The data was gathered on Monday, Wednesday was a working day, Friday was presentation day.

The exercise was guided and structured by the following instructions:
This open data exploration asks you to explore the relationships between drop heights and bounce heights for a superball. There are two explorations to be completed. The first asks you determine the relationship between drop heights and the height of the first bounce for different drop heights. The second asks you to determine the bounce height for each successive bounce when the superball is dropped from a height of 100 centimeters. For each exploration generate a table, an xy scattergraph, generate a trend line, report the equation for the trend line, and the correlation for the trend line.

First exploration
Drop the superball from at least ten different heights. Put the meter stick with the 0 cm at the bottom, 100 cm at the top. Record the height of the first bounce. Use this data to make a table of drop height in centimeters versus the bounce height in centimeters. Create an xy scattergraph, add a trend line, and then report the equation for the trend line including the slope, the intercept, the correlation and any other appropriate statistics. Would the equation predict the bounce for any drop height? What else can you tell the audience about the meaning of the slope?

Second exploration
Drop the superball from 100 centimeters high. Record the height of the first bounce. Drop the ball again from 100 cm, let the ball bounce once, and then record the height of the second bounce. Drop the ball again from 100 cm, let the ball bounce twice, and then record the height of the third bounce. Repeat drops from 100 cm until you cannot measure the bounce height any more.

Make a table of bounce number versus bounce height. Use this data to build a table, create an xy scattergraph. Can you add a trend line to the graph? What type of trend line appears to produce the best fit? For that trend line can you at least report the correlation? What does the best fit trend line suggest about bouncing - does the ball stop bouncing or do the bounces just get smaller and smaller until you cannot see them? Any idea what kind of equation might predict the bounce height for any bounce number?

In the above diagram Mitchell Marino uses Google Slides to display a Google Sheets chart of the data from the first part of the exploration. To avoid a conversion issue that arises when using the import function from Google Slides to Schoology using the Google Drive add on, one student submitted the sharing link. This generates a submission in Schoology while providing access to the native Google Slides format presentation.

The students presented their findings to the class.

True problem based learning would embed statistical learning within a larger problem framework where the nature of the problem would drive students to learn the statistics necessary to analyze the system. That level of design still eludes me.


Comments
Post a Comment